Slide 3 of 5 from 3D Clustered Chart Template for PowerPoint
6055-01-3d-clustered-chart-3
3D Clustered Chart Perspective for Presentations
- Chart
- Bar Vertical
- Data Analysis Slide
- 16:9
- 100% Editable
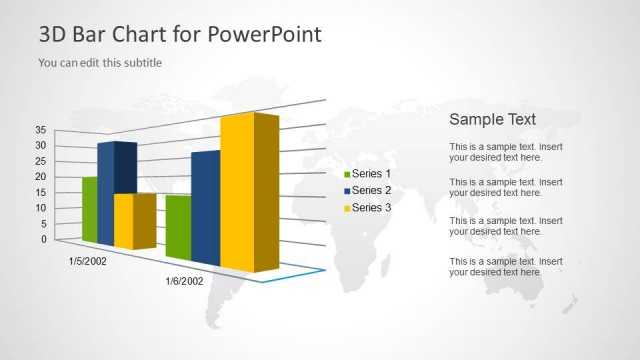
The 3D Clustered Chart Perspective slide from the 3D Clustered Chart Template for PowerPoint offers a clear visual comparison tool using a 3D bar chart, ideal for business presentations and market analysis. This slide layout supports effective data analysis by combining editable shapes and vector icons to highlight performance trends within a corporate presentation or pitch deck template.
What’s on This Slide
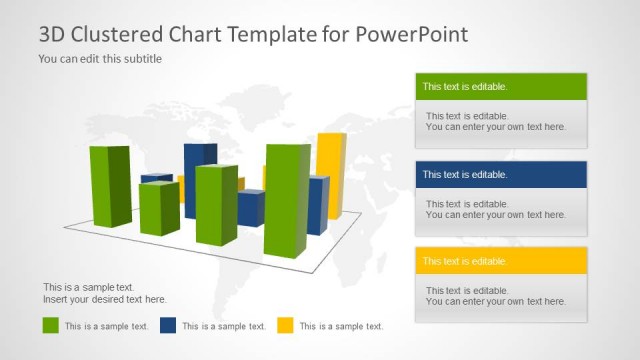
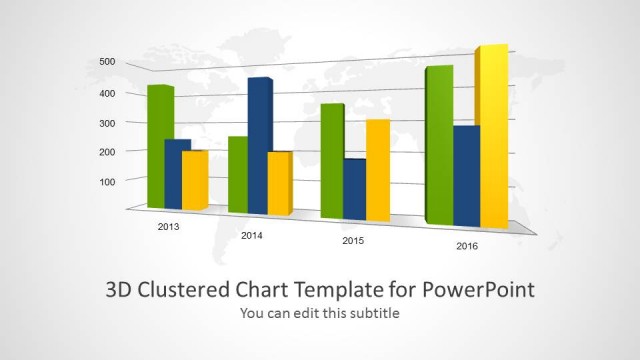
The layout features a 3D clustered bar chart positioned centrally, with bars in varying heights and colors, including green, blue, and yellow. The chart is set against a light gray background with a faint world map. Above the chart, there is a title placeholder aligned to the left and a subtitle placeholder directly beneath it. Below the chart, there are four text placeholders aligned left, indicating space for sample text. The visual hierarchy emphasizes the chart as the focal point, with the title and subtitle providing context.
How to Use It
This layout serves as a data visualization tool, ideal for presenting comparative data in a 3D format. It fits well in a presentation sequence after introducing a topic or problem, providing a visual representation of data trends. This structure is beneficial in business contexts such as performance reports, market analysis, or project updates, where clear data comparison is essential. It can be used to illustrate sales figures, survey results, or other metrics requiring visual emphasis.
Text Placeholders & Capacity
Keep your copy within these limits so it fits without resizing. Body slots are tight, roughly 5 words each.
| Placeholder | Count | Max characters (approx.) |
|---|---|---|
| Slide title | 1 | 30 |
| Subtitle | 1 | 30 |
| Body paragraph | 4 | 25 |
Slide Keywords
Download unlimited PowerPoint templates, charts and graphics for your presentations with our annual plan.
DOWNLOADReturn to 3D Clustered Chart Template for PowerPoint.