Slide 6 of 6 from 3D 4 Steps Jigsaw PowerPoint Pie Chart
4 Steps Jigsaw Puzzle 3D Pie Chart Presentation
4 Steps Jigsaw Pie Chart for Presentations
- Diagram
- Pie Chart
- Comparison Slide
- 16:9
- 100% Editable
What’s on This Slide
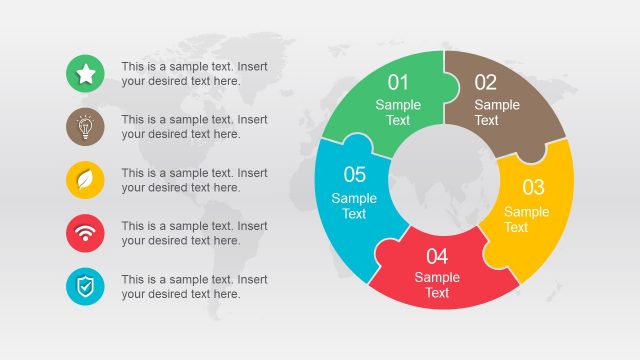
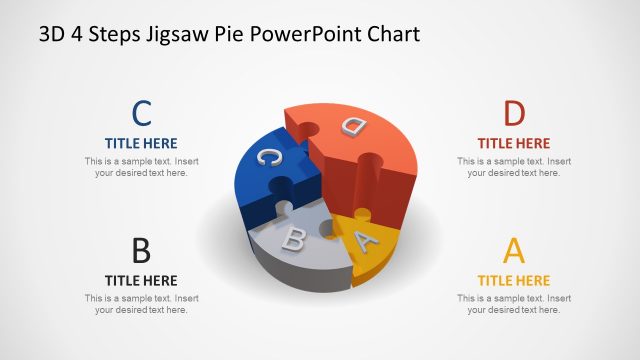
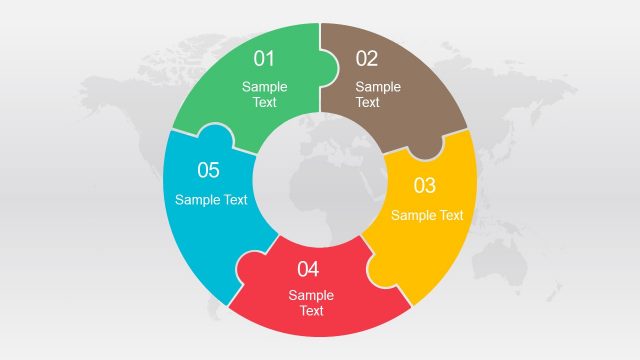
The layout features a 3D jigsaw pie chart divided into four segments, each representing a percentage. The segments are colored differently, with the largest segment on the right labeled 40%. Each segment contains a text placeholder for descriptions, positioned centrally within the segments. A title placeholder is located at the top left, while a small bar chart appears at the bottom right. The background is light, enhancing the visibility of the pie chart. The overall composition is circular, with a clear visual hierarchy emphasizing the percentages.
How to Use It
This layout serves as a visual representation of data distribution across four categories. It is suitable for illustrating parts of a whole in business presentations, such as market share, project phases, or resource allocation. Positioned towards the end of a presentation, it can summarize key findings or conclusions. This structure effectively communicates comparative data, making it ideal for reports or strategic discussions where clarity is essential.
Text Placeholders & Capacity
Keep your copy within these limits so it fits without resizing. Node labels can hold up to 10 characters each, while body text can accommodate about 50 characters.
| Placeholder | Count | Max characters (approx.) |
|---|---|---|
| Slide title | 1 | 30 |
| Item heading | 4 | 10 |
| Item body | 4 | 50 |
Slide Keywords
Download unlimited PowerPoint templates, charts and graphics for your presentations with our annual plan.
DOWNLOADReturn to 3D 4 Steps Jigsaw PowerPoint Pie Chart.