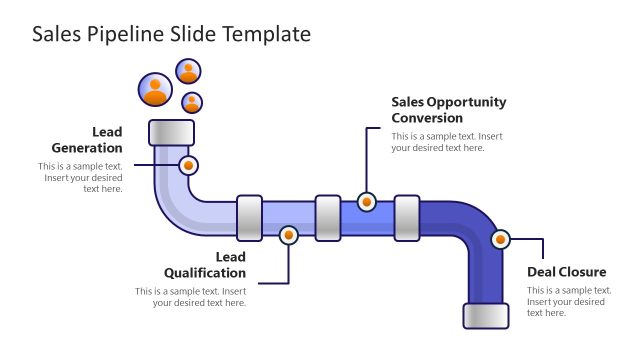
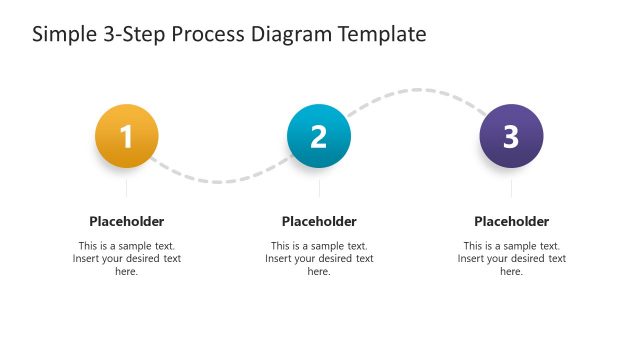
3 Step Sales Pipeline Diagram for PowerPoint
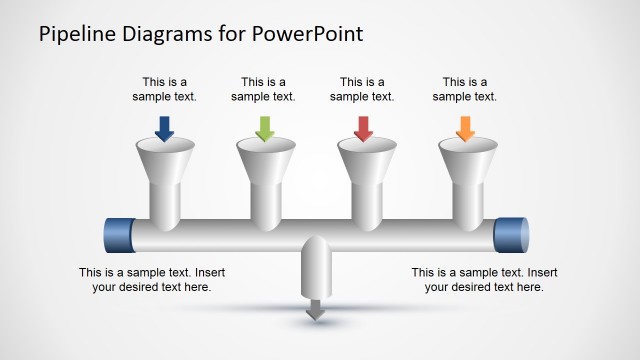
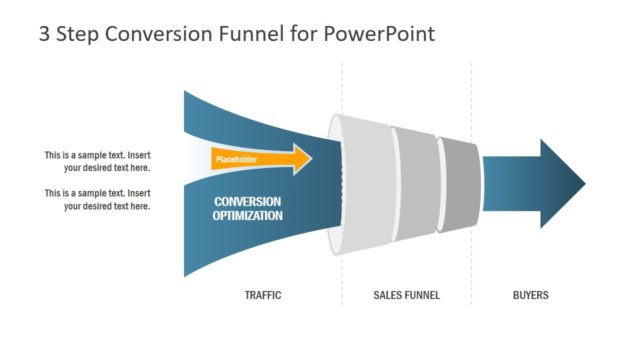
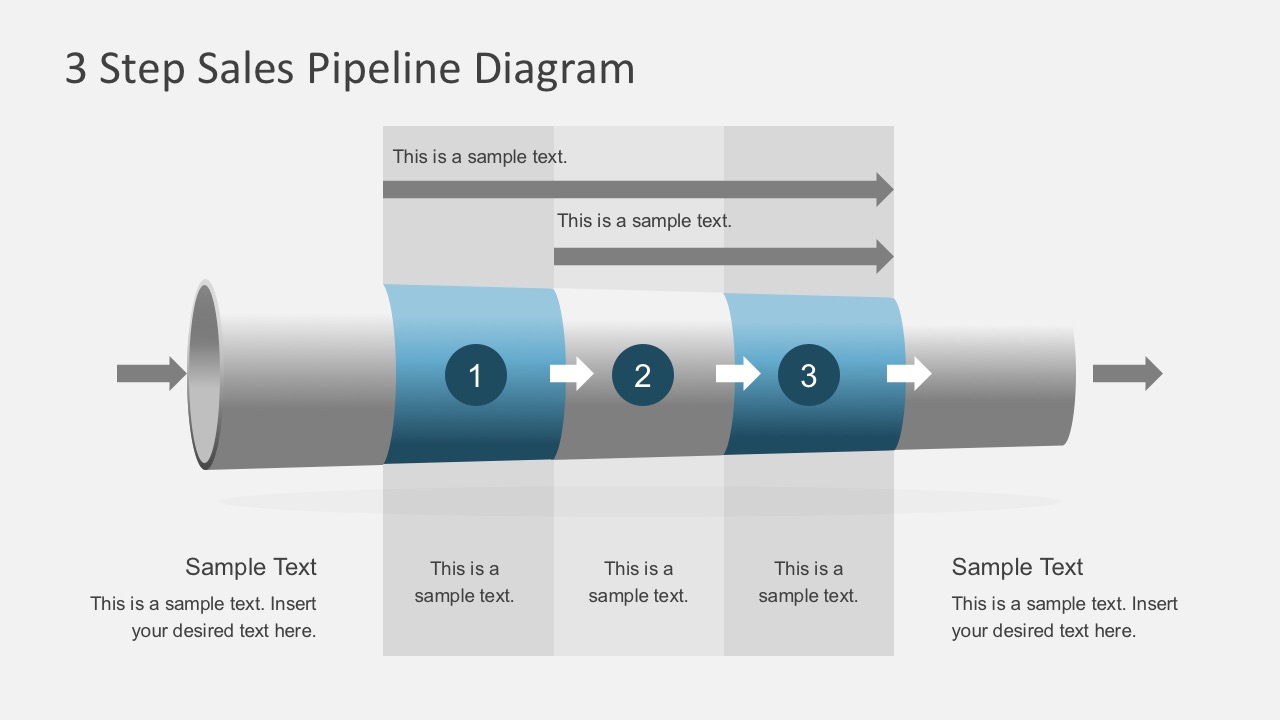
3-Step Sales Pipeline Diagram for PowerPoint is an easy-to-understand sales pipeline visual format. This PowerPoint shows how to analyze any workflow or process against established goals. Furthermore, the pipeline creates a hierarchical view of the key steps in a sales process. It directly shows the steps versus the target.
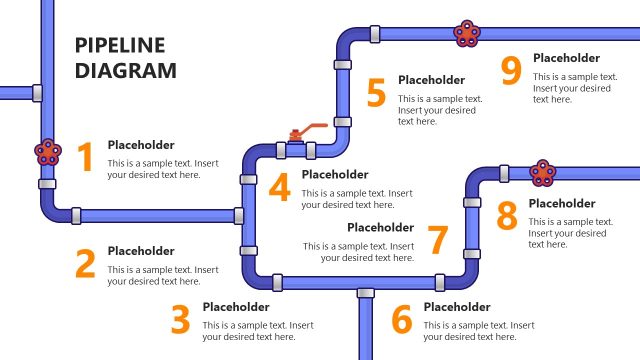
Pipeline diagrams help analyze bottleneck situations in a business process. Other practical applications of pipeline diagrams include sales management, sales analysis, continuous flow, and product-oriented analysis.
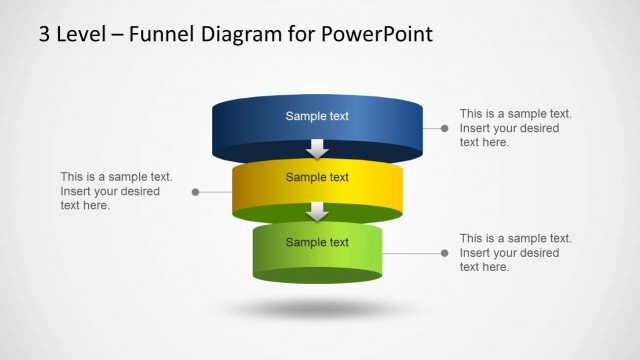
For example, the three critical measures of the sales pipeline are as follows:
- Win Rate: The percentage of potential customers passing from one stage to the next.
- Sales Cycle Time: The rate to measure cycle time for each stage to get a sense of the overall cycle time from beginning to end.
- Sales Plan: How many sales leads will be pushed into the front-end pipeline to get the targeted sales or quota?
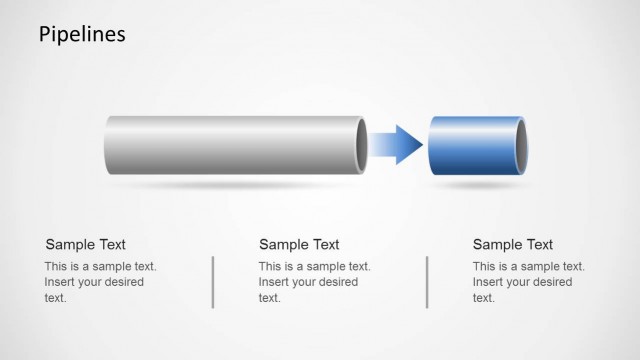
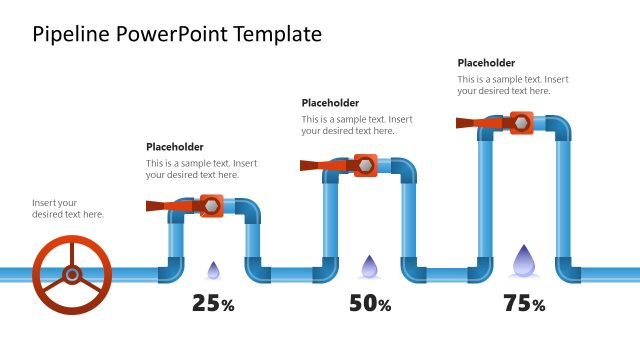
Meanwhile, users can customize this Pipeline PowerPoint. Show unique sales process. Or edit the steps to highlight a step within the diagram. Moreover, each slide design is editable. So, users can change the presentation title and steps title.
Download 3 Step Sales Pipeline Diagram for PowerPoint. Customize the diagrams to analyze the lead generation pipeline. See more diagrams for PowerPoint.

You must be logged in to download this file.
DOWNLOAD- Category
- Diagrams
- Rating


 Loading...
- Size
- 16x9
- Item ID
- 7222-01
- Colors
Subscribe today and get immediate
access to download our PowerPoint templates.