Analysis
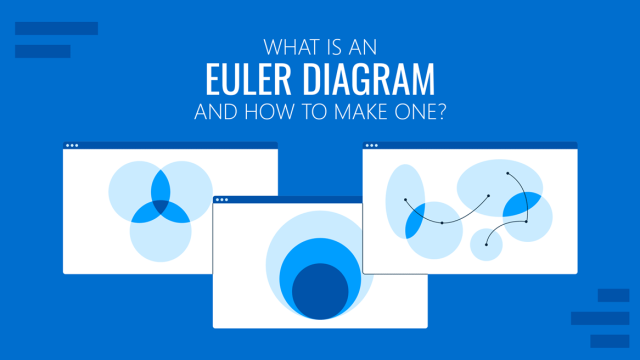
What is an Euler Diagram and How to Make One
If you aim to represent relationships between elements using mathematical models, we highly recommend you to learn how to use Euler Diagrams. Follow up this guide for definitions, step-by-step process, and tools to use.

Making Effective Group Decisions with the Stepladder Technique
Learn more about Stepladder Technique and how it can help small teams make big decisions.
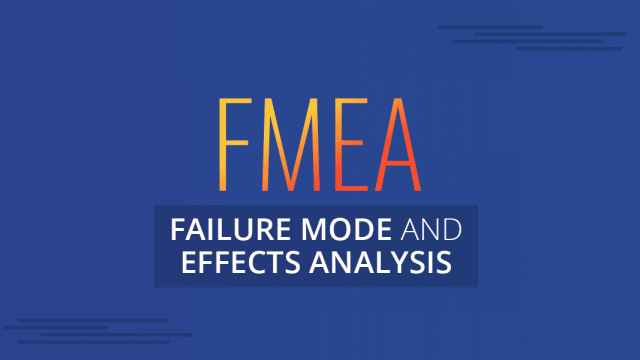
Understanding Failure Mode and Effects Analysis (FMEA)
Analyzing failure is essential for rectifying issues and preventing them in the future. It can be catastrophic for a business to have a breakdown which halts an entire process; be it the manufacturing of a product or delivery of a service. One of the early test conducted to prevent such a breakdown is often the […]

A Quick Guide to Buyer Personas Analysis
Personalization. Every marketer today understands that personalized messages hit the mark way more frequently than generic pitches. In fact, every dollar invested in advanced personalization generates twenty dollars in return.
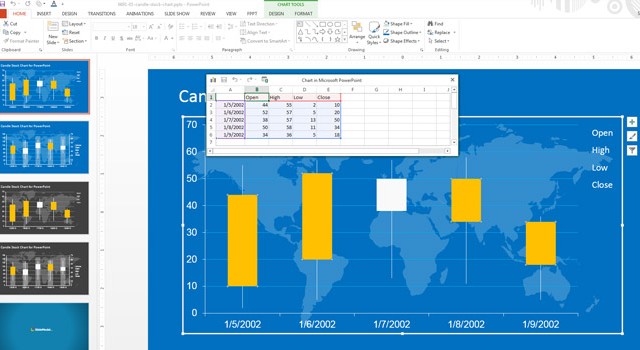
How To Edit the Candlestick Chart PowerPoint Template
The candlestick was introduced in Japan during 17th century and it was widely used for technical analysis to trade rice. The US version was initiated by Charles Dow around 1900, although many of the guiding principles were very similar. Candlestick is a chart that displays the high, low, opening and closing prices for a security. This kind […]
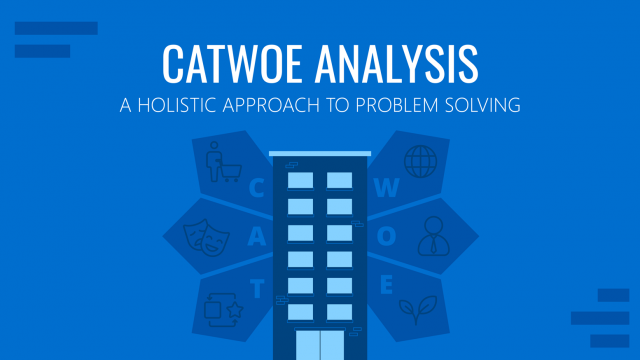
CATWOE Analysis: A Holistic Approach to Problem Solving
In this article, we explore what CATWOE Analysis is and how it can be used as a powerful problem-solving tool.