Slide 2 of 4 from Multistep Business Diagram Designs
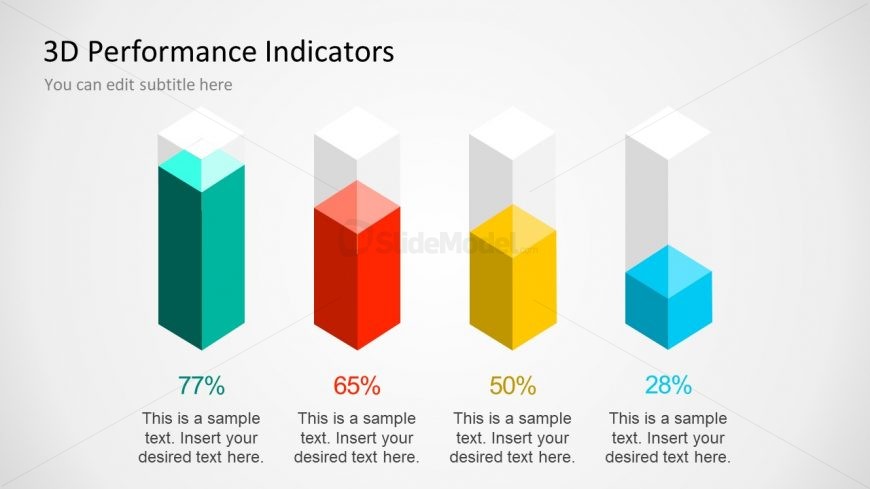
3D Bar Diagram of Performance Indicators
3D Performance Indicators Slide
- Chart
- Bar Vertical
- Evaluation Slide
- 16:9
- 100% Editable
What’s on This Slide
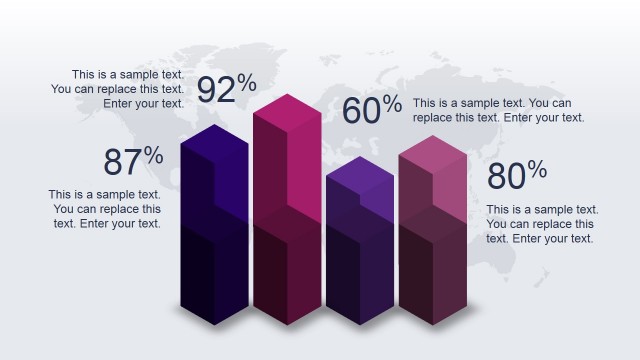
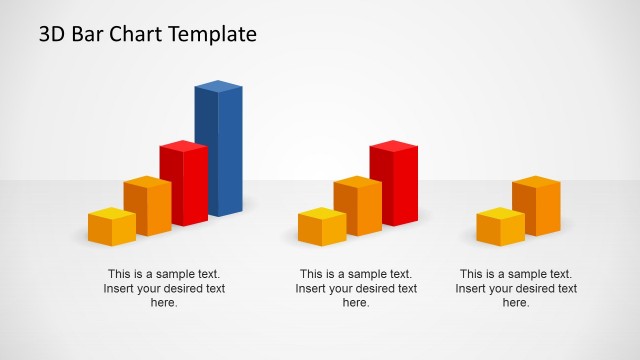
The slide features four vertical 3D bar indicators arranged horizontally. Each bar has a distinct color: teal, red, yellow, and blue, representing different performance metrics. The bars vary in height, visually indicating performance levels of 77%, 65%, 50%, and 28%, respectively. Above each bar, there are text placeholders for percentage values, aligned centrally. Below, additional text placeholders are present for descriptive content, aligned similarly. The background is light gray, providing contrast to the colorful bars. The overall layout emphasizes the performance indicators clearly.
How to Use It
This layout serves as a visual representation of performance metrics, ideal for business presentations. It fits well after a problem slide, illustrating performance levels or results. Scenarios include presenting sales figures, project completion rates, or KPI tracking. The structure allows for easy comparison of multiple metrics, making it suitable for performance reviews or strategic planning discussions. Use it to highlight achievements or areas needing improvement in a concise manner.
Text Placeholders & Capacity
Keep your copy within these limits so it fits without resizing. Node labels can hold short text, while body slots allow for brief descriptions.
| Placeholder | Count | Max characters (approx.) |
|---|---|---|
| Chart title | 1 | 30 |
| Item heading | 4 | 3 |
| Item body | 4 | 50 |
Slide Keywords
Download unlimited PowerPoint templates, charts and graphics for your presentations with our annual plan.
DOWNLOADReturn to Multistep Business Diagram Designs.