Slide 7 of 8 from Free Three Topics Business Template
Free 4 Steps Chart Template PowerPoint
Sample Chart with Icons for Business Presentations
- Chart
- Bar Vertical
- Evaluation Slide
- 16:9
- 100% Editable
The Sample Chart with Icons slide from the Free Three Topics Business Template offers a clear way to present key metrics and performance indicators using editable shapes and vector icons. This slide layout is well-suited for business presentations and pitch decks that require effective data visualization combined with concise iconography to highlight strategic initiatives.
What’s on This Slide
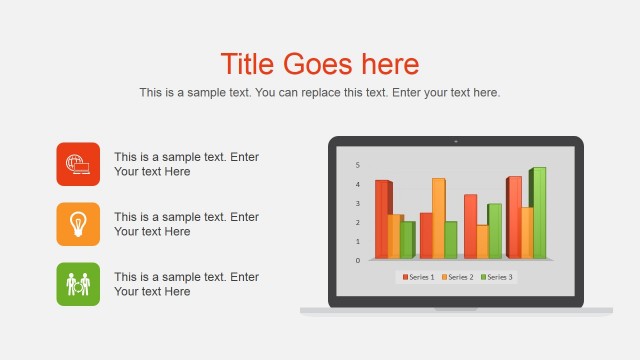
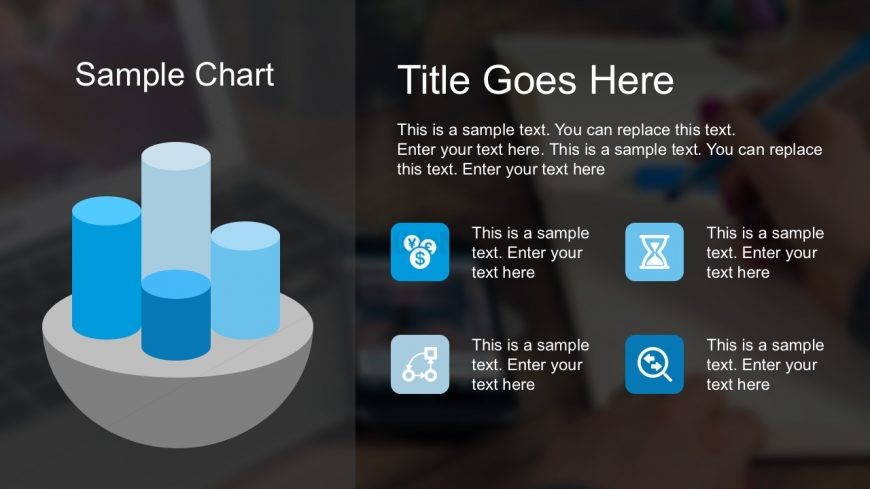
The slide features a central chart composed of five cylindrical shapes in varying heights, representing data visually. The chart is placed in the center-left area, surrounded by four icon boxes on the right. Each icon box contains a circular icon with a corresponding text placeholder below. The icons include a dollar sign, a clock, a network diagram, and a magnifying glass. Text placeholders are aligned vertically, with the title at the top center. The background is a gradient, enhancing the visual hierarchy and separation of elements.
How to Use It
This layout serves as a data visualization tool, ideal for presenting key metrics or comparisons. It fits well in a business presentation sequence, particularly after introducing a problem or topic. Use this slide to summarize findings, showcase performance indicators, or highlight strategic initiatives. It is suitable for meetings, reports, or pitches where clear data representation is essential.
Text Placeholders & Capacity
Keep your copy within these limits so it fits without resizing. Node labels can accommodate roughly 10-15 words each.
| Placeholder | Count | Max characters (approx.) |
|---|---|---|
| Chart title | 1 | 30 |
| Item heading | 4 | 50 |
| Item body | 4 | 100 |
Slide Keywords
Download unlimited PowerPoint templates, charts and graphics for your presentations with our annual plan.
DOWNLOADReturn to Free Three Topics Business Template.