Slide 11 of 15 from Free Sunset PowerPoint Background
Data Driven Pie Chart Free PPT Slide
Pie Chart Slide for Presentations
- Chart
- Pie Chart
- Evaluation Slide
- 16:9
- 100% Editable
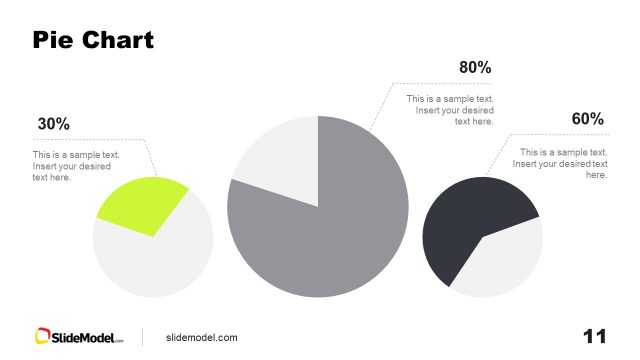
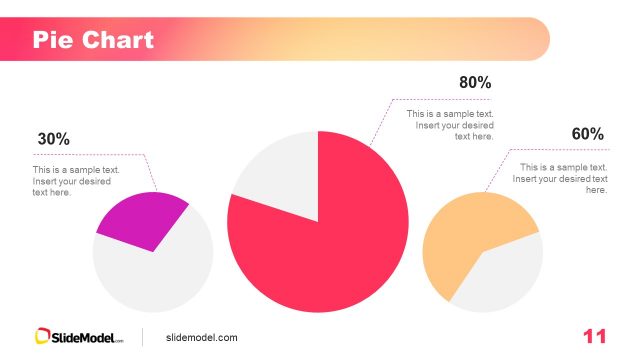
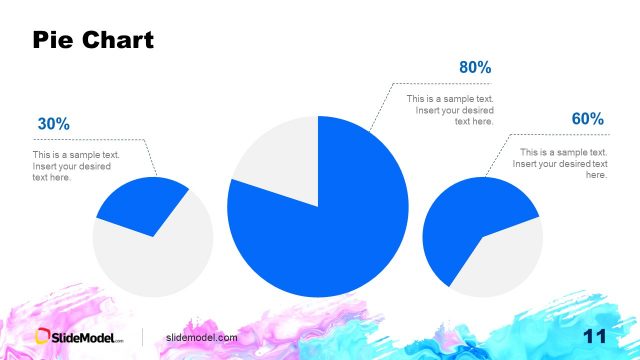
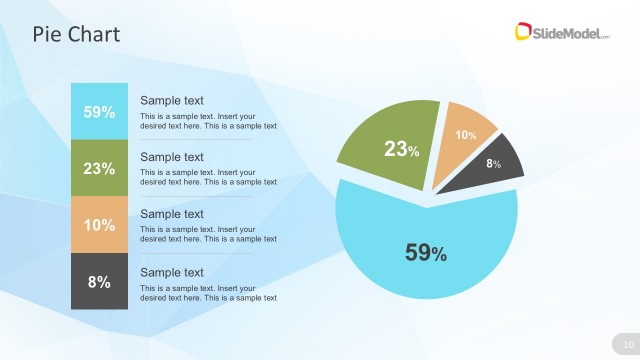
The Pie Chart slide layout from the Free Sunset PowerPoint Background template effectively visualizes market share analysis and performance evaluation through three distinct pie charts. Each chart is designed to present data clearly, making it an excellent choice for business presentations and reports.
What’s on This Slide
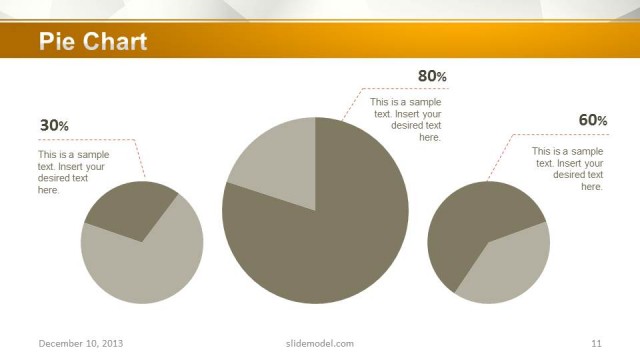
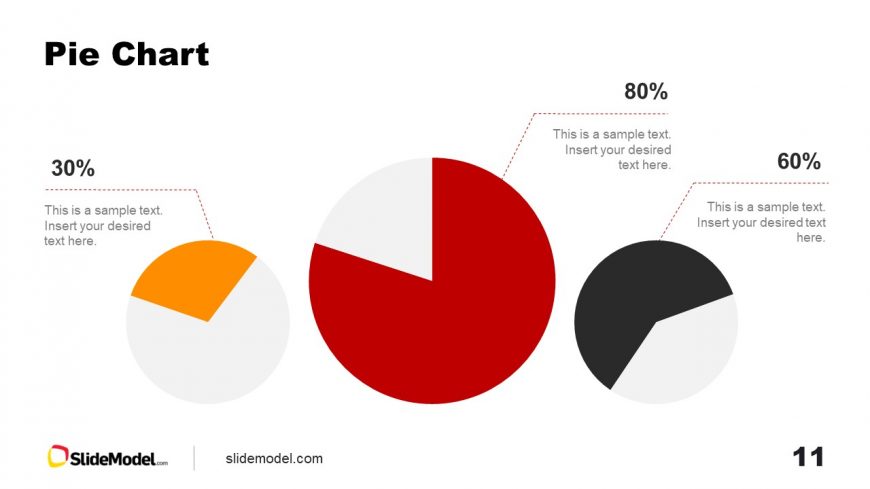
The slide features three pie charts arranged horizontally. The left chart represents 30%, the middle chart represents 80%, and the right chart represents 60%. Each chart is accompanied by a text placeholder for descriptions, positioned to the right of the respective pie. The charts are colored in orange, red, and black, with a white background. The visual hierarchy emphasizes the largest pie chart in the center. Text placeholders are aligned to the right of each pie, maintaining a consistent layout. The overall composition is clean and organized.
How to Use It
This layout serves to visually compare multiple data points using pie charts. It is suitable for presentations that require illustrating proportions or distributions, such as market share analysis or survey results. This slide fits well in a sequence following data introduction or problem framing, allowing for a clear visual representation of key metrics. Ideal scenarios include business reports, project updates, and performance evaluations, where visual data representation is crucial.
Text Placeholders & Capacity
Keep your copy within these limits so it fits without resizing. Data label slots can hold roughly 30 characters each.
| Placeholder | Count | Max characters (approx.) |
|---|---|---|
| Chart title | 1 | 20 |
| Data label | 3 | 30 |
| Item body | 3 | 40 |
Slide Keywords
Download unlimited PowerPoint templates, charts and graphics for your presentations with our annual plan.
DOWNLOADReturn to Free Sunset PowerPoint Background.