Slide 1 of 8 from Free Smart Chart PowerPoint Templates
Free Smart Pie Chart PowerPoint Templates
Pie Chart Comparison Slide for Presentations
- Chart
- Pie Chart
- Evaluation Slide
- 16:9
- 100% Editable
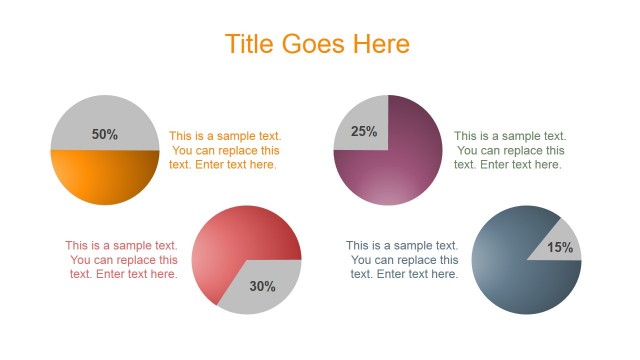
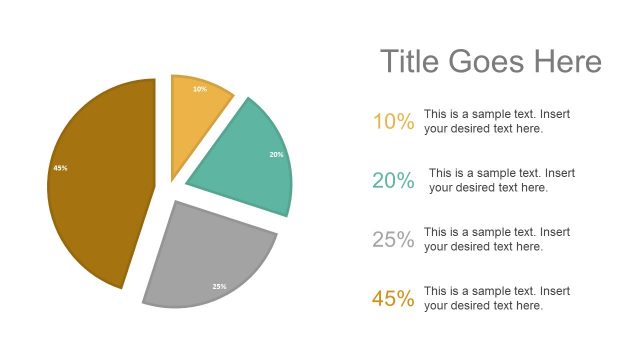
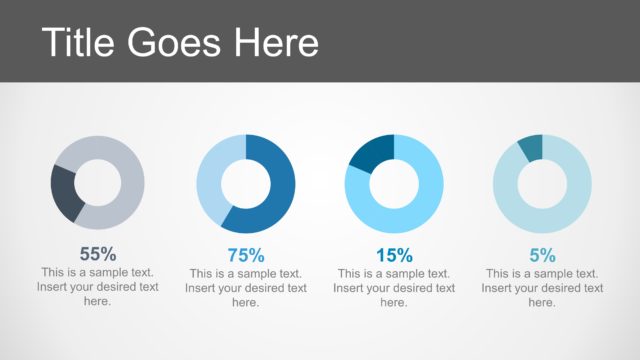
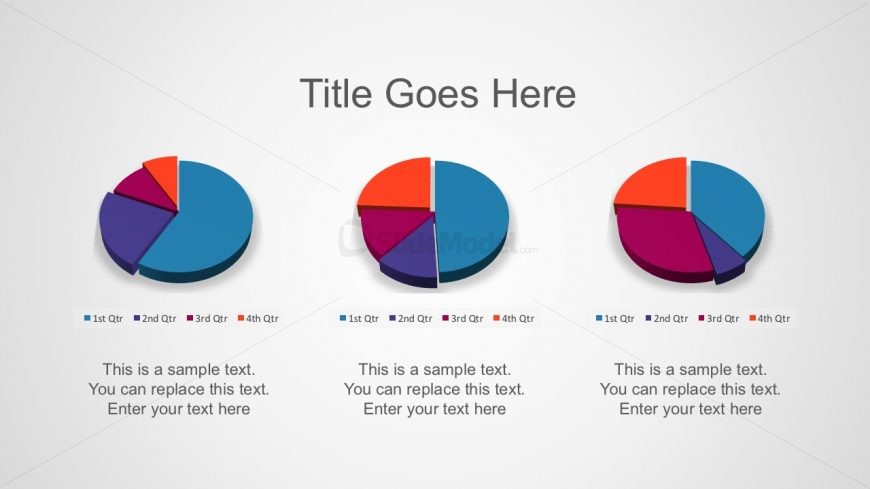
The Pie Chart Comparison slide from the Free Smart Chart PowerPoint Templates offers a clear layout for evaluating quarterly performance and financial data. This slide template includes editable shapes and vector icons arranged to facilitate side-by-side data comparison, making it suitable for business presentations and pitch deck templates that require precise visual analysis.
What’s on This Slide
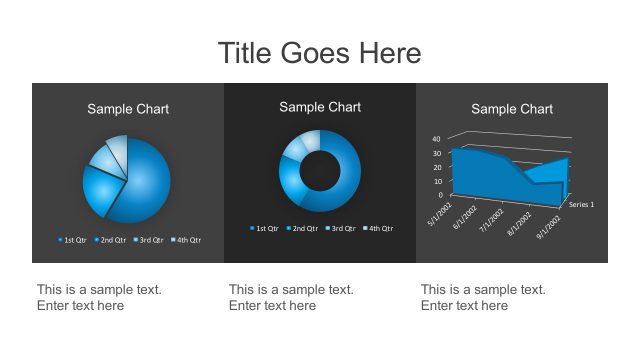
The slide features three pie charts arranged horizontally across the center. Each pie chart is segmented into four colored sections, representing different quarters. Below each pie chart, there is a text placeholder for descriptions, aligned centrally. The title placeholder is located at the top center, with a larger font size than the body text. The background is light gray, providing contrast to the colorful charts. The overall layout is clean, with a focus on the visual data representation and accompanying text.
How to Use It
This layout serves as a comparative analysis tool, ideal for showcasing data across multiple categories. It fits well in presentations that require visual data representation, such as quarterly performance reviews or market analysis. The structure allows for clear differentiation between data sets, making it suitable for business meetings, financial reports, or educational contexts where comparison is essential. Use it to highlight trends or changes over time effectively.
Text Placeholders & Capacity
Keep your copy within these limits so it fits without resizing. Body slots can hold about 10 words each.
| Placeholder | Count | Max characters (approx.) |
|---|---|---|
| Slide title | 1 | 30 |
| Item body | 3 | 50 |
Slide Keywords
Download unlimited PowerPoint templates, charts and graphics for your presentations with our annual plan.
DOWNLOADReturn to Free Smart Chart PowerPoint Templates.