Slide 5 of 8 from Free Simple Product PowerPoint Template
Stacked PowerPoint Chart Template
3D Data Chart Slide for Presentations
- Chart
- 3d Area Chart
- Evaluation Slide
- 16:9
- 100% Editable
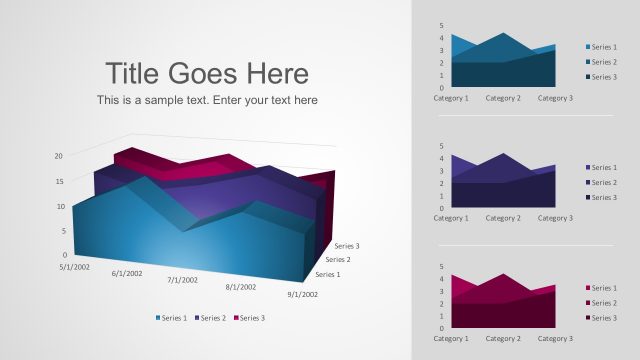
The Data Chart slide from the Free Simple Product PowerPoint Template offers a clear 3D area chart layout ideal for business presentations such as sales performance reviews and market analysis. This slide template integrates editable shapes and vector icons to visually communicate data trends effectively within a corporate presentation or pitch deck template.
What’s on This Slide
The slide features a 3D data chart positioned centrally against a blue background. The chart displays multiple colored areas representing different data series, with a gradient effect. Text placeholders are located to the right of the chart, arranged vertically, with each placeholder labeled 'TEXT.' The chart includes a horizontal axis with date labels and a vertical axis indicating values. The overall layout emphasizes the chart while maintaining a clear visual hierarchy with the title at the top left.
How to Use It
This layout serves as a data visualization tool, ideal for presenting trends or comparisons in business contexts. It fits well in a sequence after introductory slides, providing a visual representation of data. Suitable scenarios include sales performance reviews, market analysis, or project progress updates. Use this layout to effectively communicate quantitative information and support decision-making processes.
Text Placeholders & Capacity
Keep your copy within these limits so it fits without resizing. The title slot can hold about 3-5 words, while body slots are tight, roughly 8 words each.
| Placeholder | Count | Max characters (approx.) |
|---|---|---|
| Slide title | 1 | 20 |
| Item body | 4 | 50 |
Slide Keywords
Download unlimited PowerPoint templates, charts and graphics for your presentations with our annual plan.
DOWNLOADReturn to Free Simple Product PowerPoint Template.