Free Simple 3 Stage Process Diagram for PowerPoint
Download Free Simple 3 Stage Process Diagram for PowerPoint & Google Slides
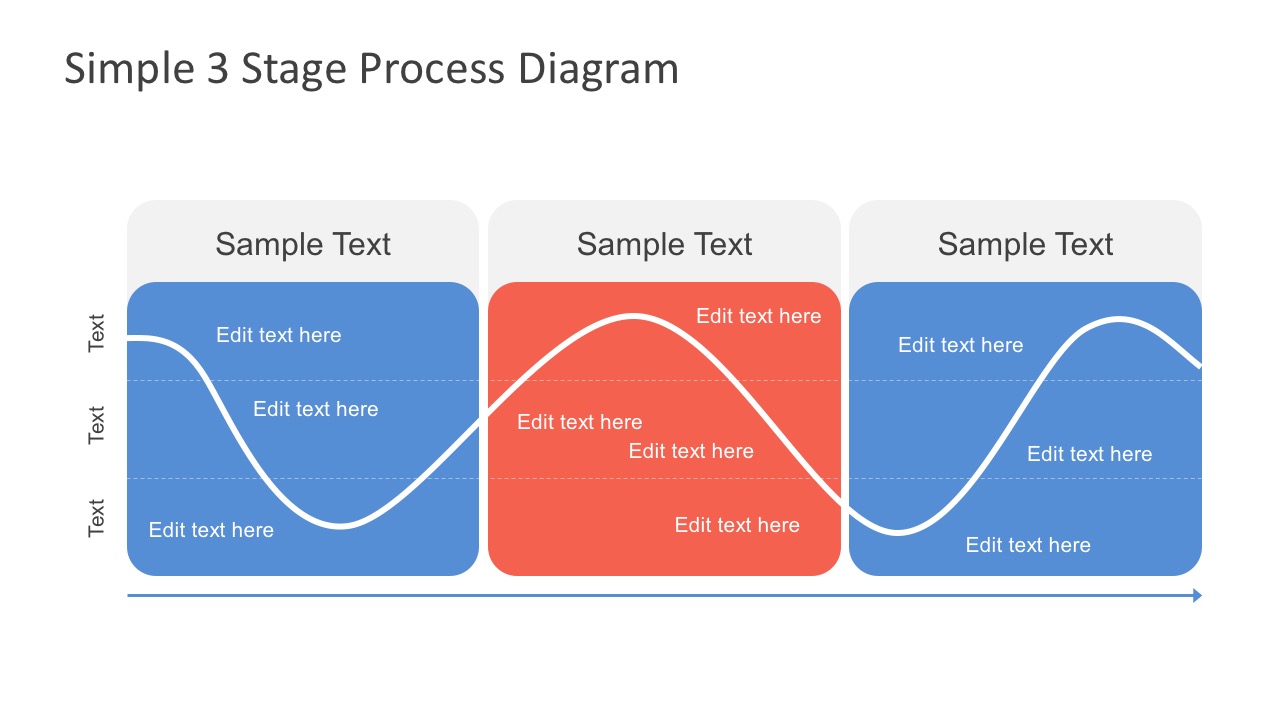
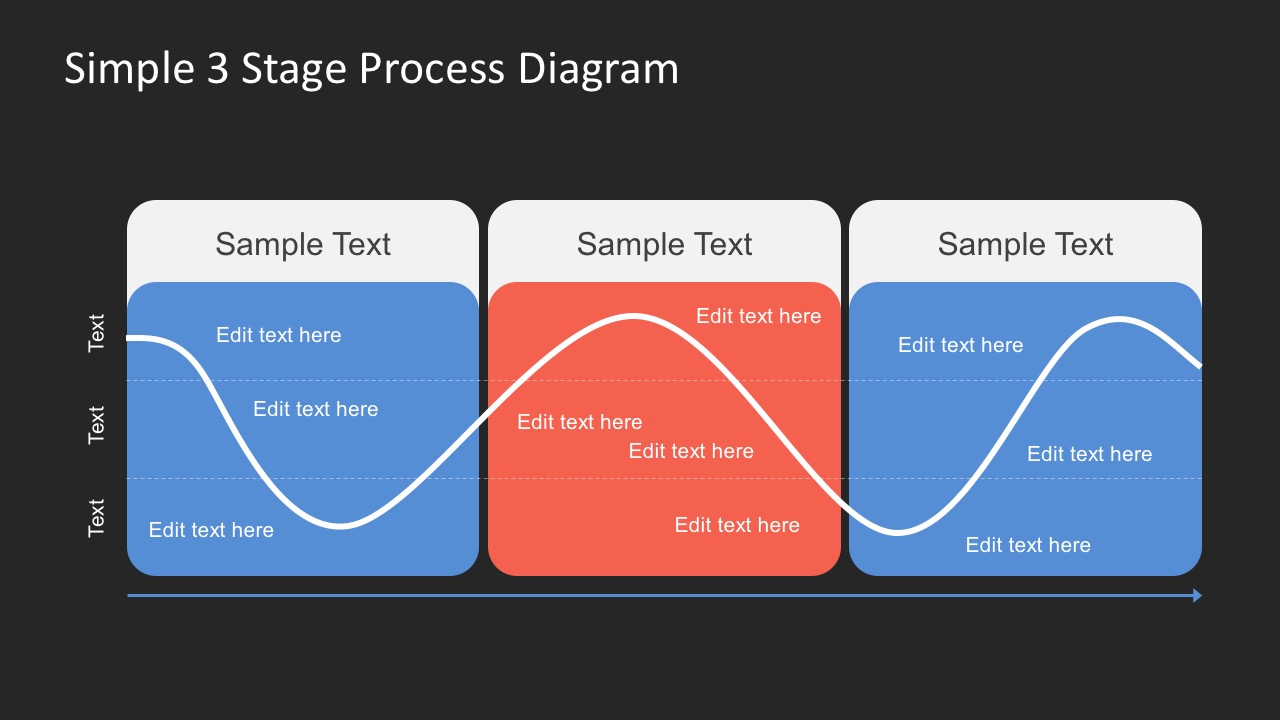
Free Simple 3 Stage Process Diagram for PowerPoint. A two slide presentation in white and black template background. A flat diagram chart with 3-stages. The stages are editable column charts. Meanwhile, the columns are in alternating colors to provide aesthetic and easy visualization. Every stage has 3-parts which stand as the rows laid out as dotted lines with text on the side.
Inside the diagram charts are text placeholders with title text boxes. Also, there is a sine wave curve running across the entire diagram. While at the bottom of the 3-Stage Process Diagram is a straight solid arrow. It indicates that the diagram is a continuous linear process from left to right following the arrow head.
The sine wave curve describes a smooth repetitive oscillation or the up down movement in the process diagram. The rise and fall vary on the factors. Moreover, the curve, lines, and arrows in the diagram are vectors. Thus, users of Free Simple 3 Stage Process Diagram for PowerPoint can edit, copy, paste, or change the results plotted in the diagram.
Download Free Simple Process Diagram to present process, data, and trend. Hence, look into the gallery to see innovative diagrams and charts for presentation.
FEATURES
- 100% Editable PowerPoint Templates & Google Slides.
- Compatible with all major Microsoft PowerPoint versions, Keynote and Google Slides.
- Modern 16:9 Aspect Ratio.
- Scalable Vectorial PowerPoint Shapes and PowerPoint Icons.
- Instant Access and Download.
- New Templates every week.
Google Slides Preview
Our PowerPoint Templates are compatible with Google Slides. Take the most of every platform using the tool you like.


