Free Sales Management Dashboard PowerPoint Template
Download Free Sales Management Dashboard PowerPoint Template & Google Slides
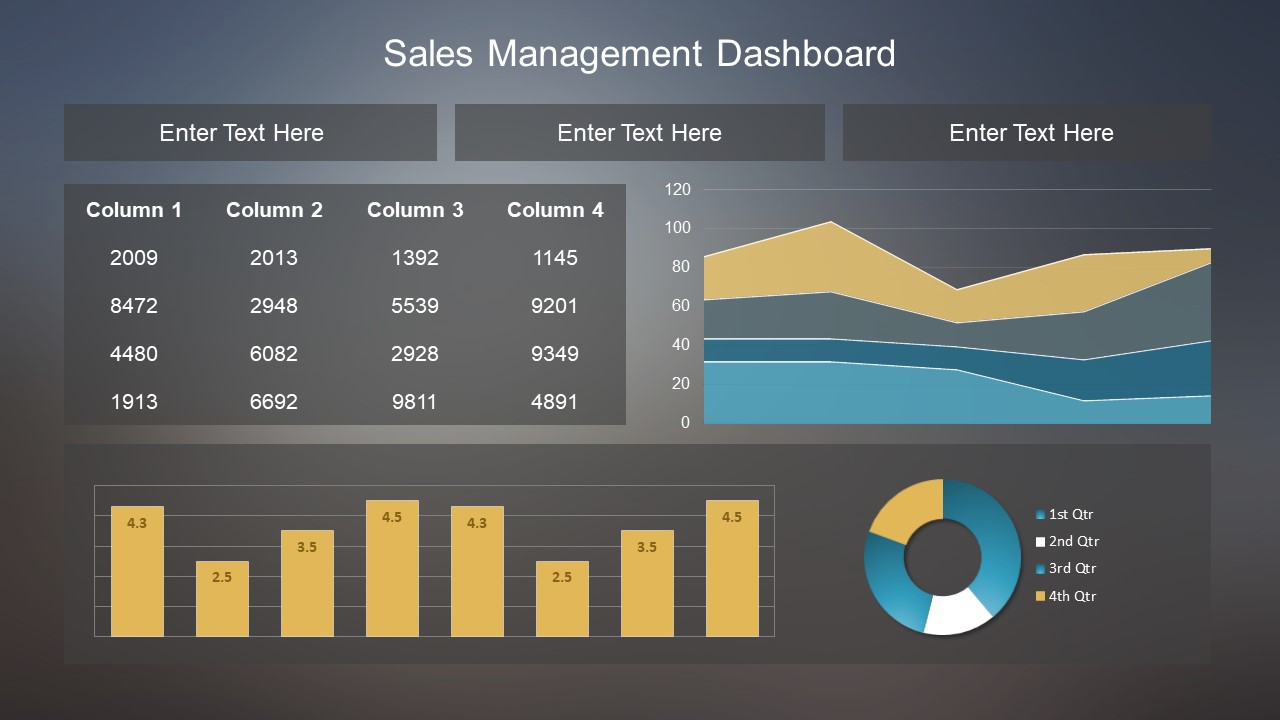
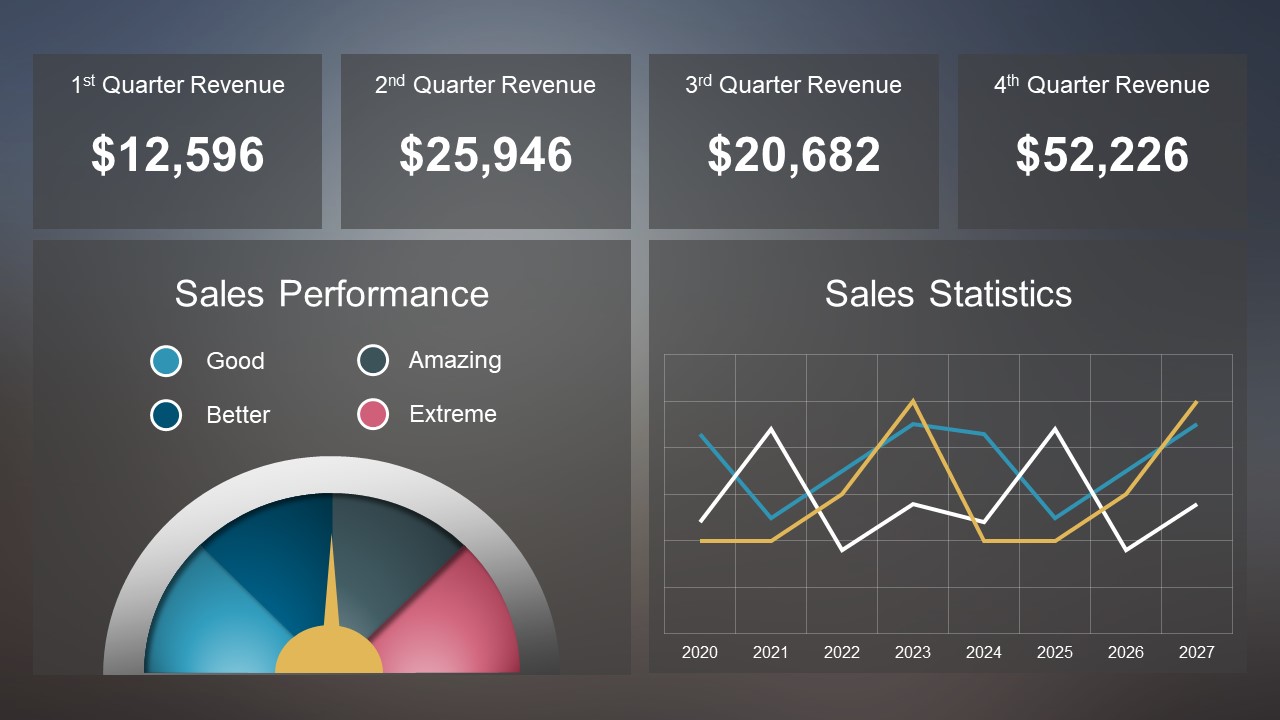
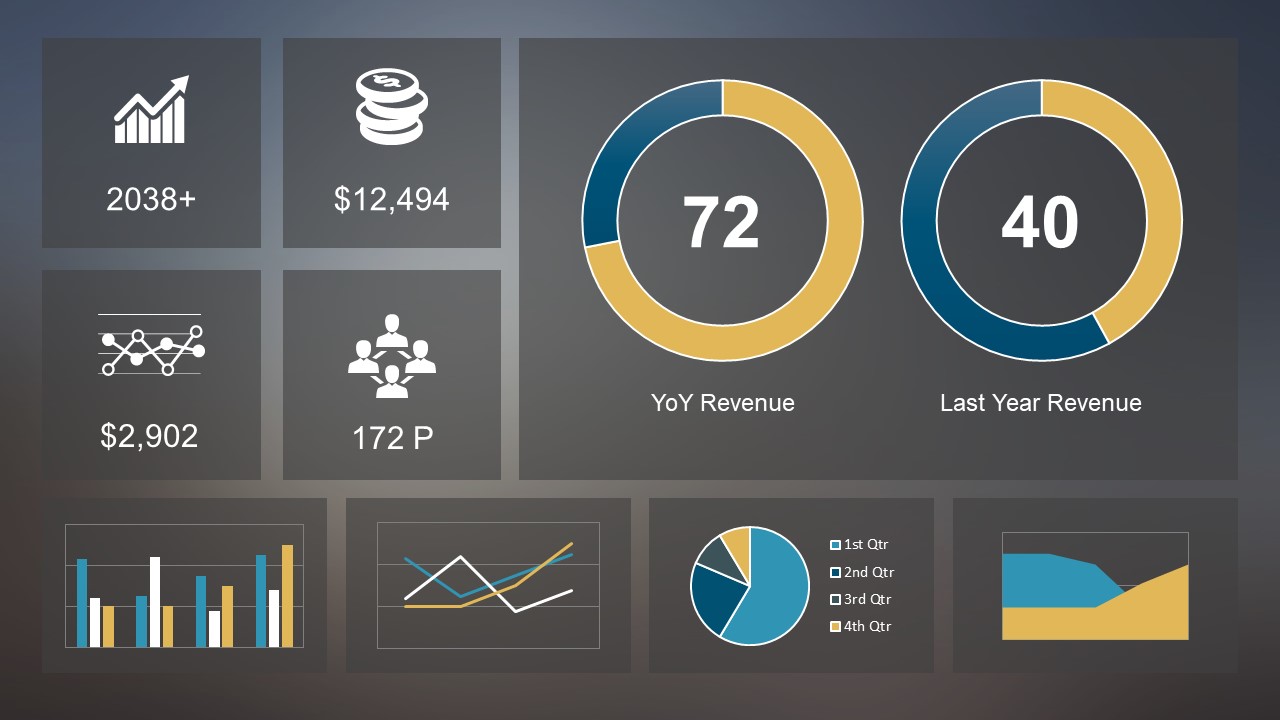
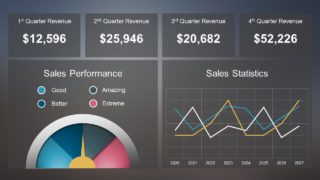
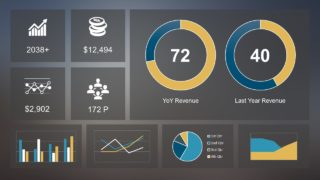
The Free Sales Management Dashboard PowerPoint Template presents busy slides for business performance reports. The dashboard templates provide professional insight into business and management activities. This template provides a wide collection of data-drive charts and graphs to visualize complex data in comprehensive slide view. Because sales and management dashboards are useful business tools to display interrelated KPIs. The data charts on dashboards give an overview of performance and improve productivity. Because viewers can view various performance charts at once and identify processes that need attention.
The business PowerPoint template of dashboards contains 3 free slides of charts and visual diagram. These slides are useful layouts for demonstrating reports, project status, sales targets, etc. The professionals can take advantage of these slides to transform complex business information into more visible designs. Further, these dashboard templates will help forecast process outcomes and make timely decisions.
The Free Sales Management Dashboard PowerPoint Template include pre-design custom data drive charts. The custom charts are a combination of two or more PowerPoint charts. Here, the charts include stacked, single and multiple bars, donut, line graph, and pie chart. Furthermore, the free slides of management dashboard also include flat diagrams and clipart icons for graphical representation of topics.
The data-driven charts in PowerPoint assist professionals in creating sales reporting and statistical analysis presentations quickly. Because users can simply modify data values and apply logic based on their performance indicators. These charts take data value inputs and update layouts effortlessly. The users make additional customizations to these sales and management dashboard slides. Such as changing colors, text, clipart icons, or apply animations, etc.
FEATURES
- 100% Editable PowerPoint Templates & Google Slides.
- Compatible with all major Microsoft PowerPoint versions, Keynote and Google Slides.
- Modern 16:9 Aspect Ratio.
- Scalable Vectorial PowerPoint Shapes and PowerPoint Icons.
- Instant Access and Download.
- New Templates every week.
Google Slides Preview
Our PowerPoint Templates are compatible with Google Slides. Take the most of every platform using the tool you like.
