Slide 6 of 11 from Free Research Paper PowerPoint Template
Data Presentation Charts & Graphs
Data Presentation / Findings Slide
- Chart
- Bar Vertical
- Evaluation Slide
- 16:9
- 100% Editable
What’s on This Slide
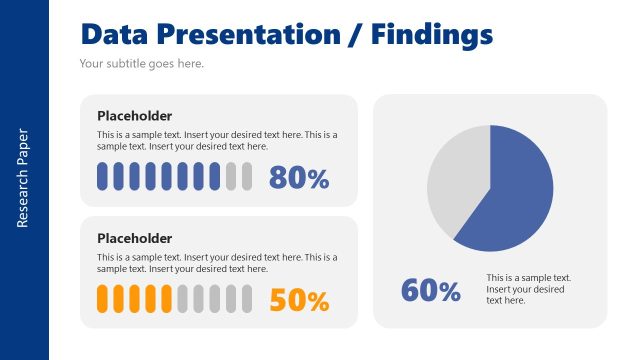
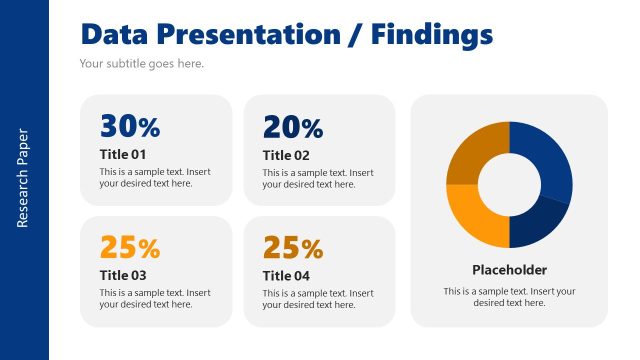
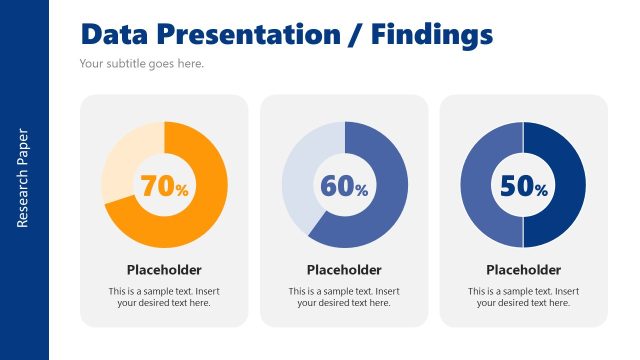
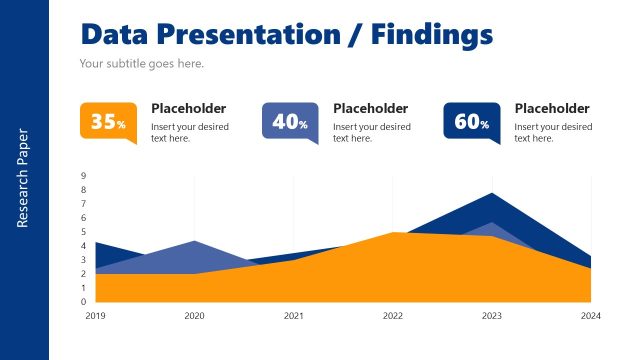
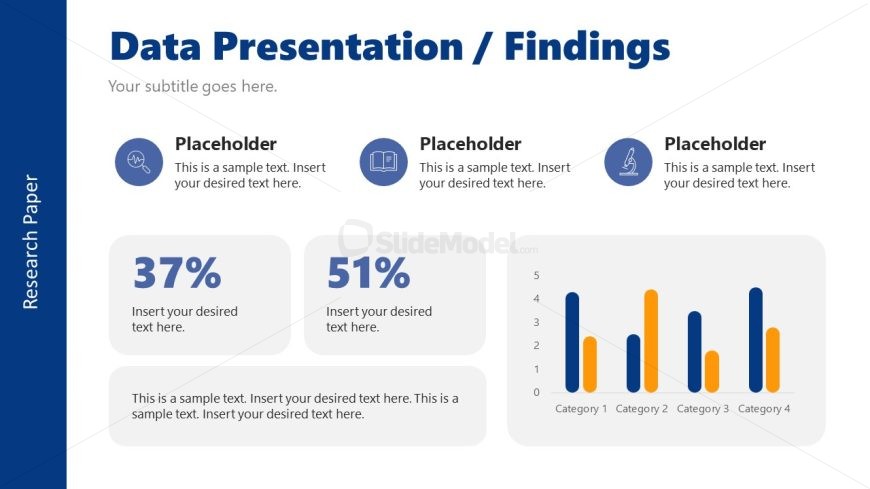
The layout features a left-aligned vertical blue sidebar with a title and subtitle at the top. Below, there are three circular icons with text placeholders positioned horizontally. To the right, two large percentage placeholders are centered, followed by a text placeholder below them. At the bottom right, a bar chart displays four vertical bars in varying colors, labeled with categories. The overall composition is balanced, with a clear visual hierarchy emphasizing the title and data points. Background colors are light, enhancing readability.
How to Use It
This layout serves to present data findings in a structured manner, making it suitable for research presentations. It fits within a sequence that discusses methods and results. This slide is ideal for summarizing key statistics and visual data, allowing for clear communication of research outcomes. It can be used in academic or business contexts where data visualization is essential to support arguments or conclusions, making it effective for presenting survey results or performance metrics.
Text Placeholders & Capacity
Keep your copy within these limits so it fits without resizing. Body slots are tight, roughly 20 words each.
| Placeholder | Count | Max characters (approx.) |
|---|---|---|
| Slide title | 1 | 30 |
| Subtitle | 1 | 50 |
| Item heading | 4 | 15 |
| Item body | 4 | 20 |
| Body paragraph | 1 | 150 |
Slide Keywords
Download unlimited PowerPoint templates, charts and graphics for your presentations with our annual plan.
DOWNLOADReturn to Free Research Paper PowerPoint Template.