Slide 7 of 11 from Free Research Paper PowerPoint Template
Creative Slide for Presenting Data Findings
Data Presentation / Findings Slide
- Chart
- Bar Horizontal
- Data Findings Slide
- 16:9
- 100% Editable
What’s on This Slide
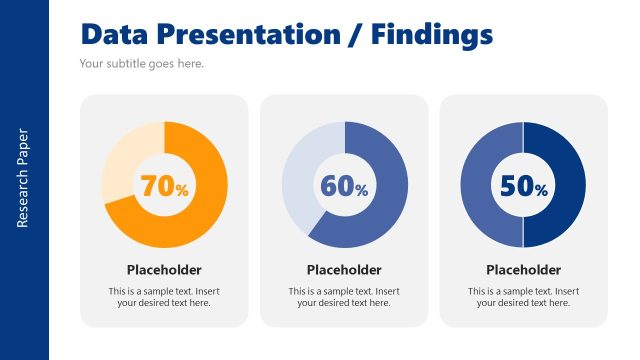
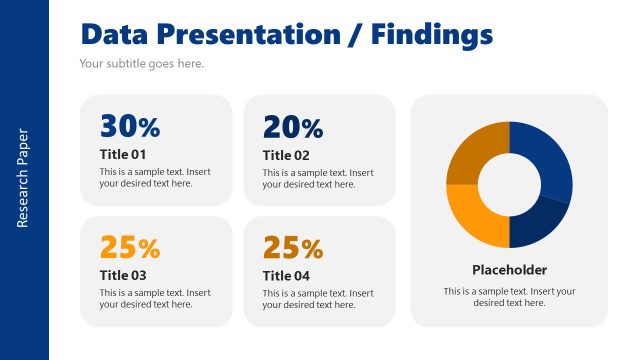
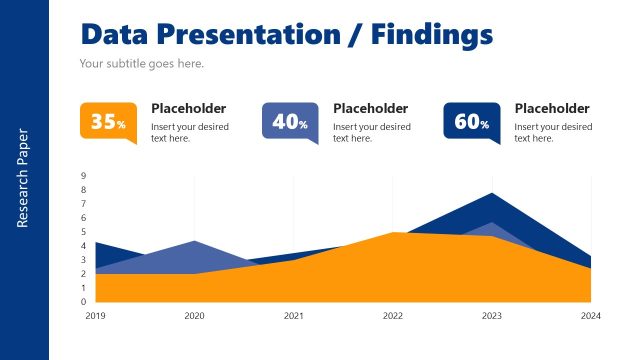
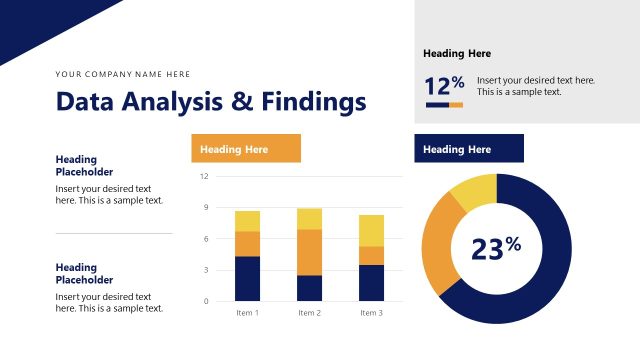
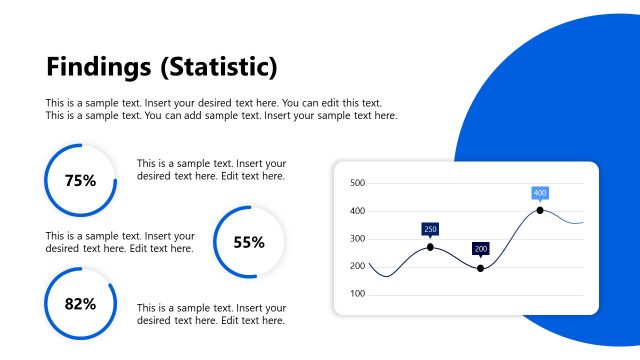
The layout features a left-aligned vertical blue sidebar with the label 'Research Paper.' At the top, a large title reads 'Data Presentation / Findings' in bold, dark blue text. Below the title, a subtitle placeholder is centered. Two sections are arranged vertically in the main area. The top section contains a horizontal bar chart with a blue bar representing 80%, alongside a placeholder for text. The bottom section features another horizontal bar chart with an orange bar indicating 50%, also with a text placeholder. A pie chart on the right displays a 60% segment in dark blue, accompanied by a text placeholder.
How to Use It
This layout is suitable for presenting quantitative findings in a research context. It effectively displays comparative data through bar charts and a pie chart, making it ideal for summarizing results or key metrics. This slide fits well in a sequence following data collection or analysis slides, providing a clear visual representation of findings. It can be used in various research presentations, such as academic reports, market research, or project evaluations, where data visualization is essential for conveying insights.
Text Placeholders & Capacity
Keep your copy within these limits so it fits without resizing. Text slots are moderate, roughly 20-30 words each.
| Placeholder | Count | Max characters (approx.) |
|---|---|---|
| Slide title | 1 | 40 |
| Subtitle | 1 | 60 |
| Item heading | 2 | 20 |
| Item body | 2 | 150 |
| Data label | 3 | 10 |
Slide Keywords
Download unlimited PowerPoint templates, charts and graphics for your presentations with our annual plan.
DOWNLOADReturn to Free Research Paper PowerPoint Template.