Slide 10 of 11 from Free Research Paper PowerPoint Template
Area Plot Data Visualization Slide – Research Template
Data Presentation Findings Slide for Research Papers
- Chart
- Line Chart
- Evaluation Slide
- 16:9
- 100% Editable
What’s on This Slide
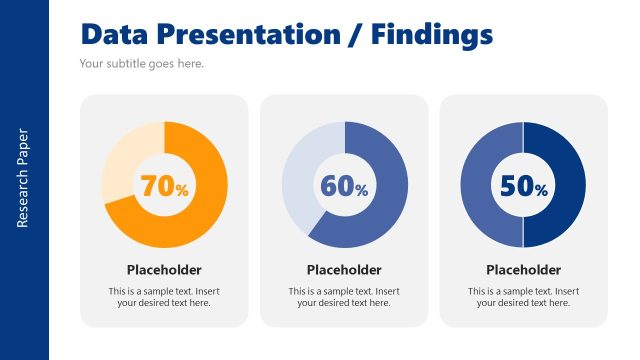
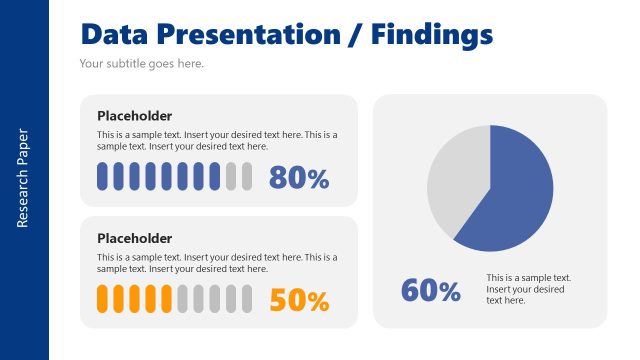
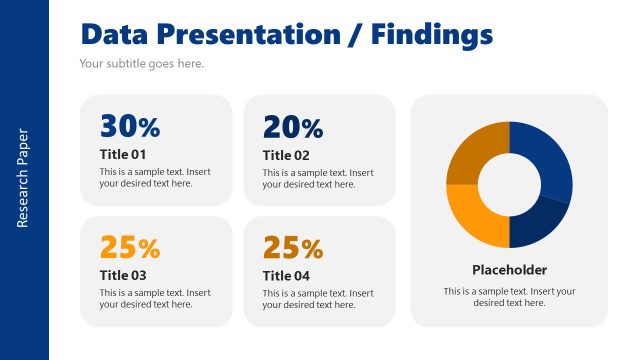
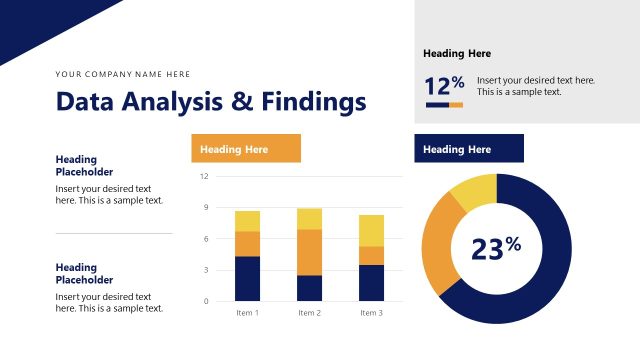
The layout features a large title at the top, stating 'Data Presentation / Findings,' with a subtitle placeholder directly below. To the right, three percentage labels are displayed in rounded rectangles, each accompanied by a placeholder for additional text. Below these labels, a line graph illustrates data trends over the years 2019 to 2024, with distinct areas shaded in orange and blue. The graph includes vertical axis markers and a horizontal timeline. The overall composition is left-aligned, with a bold blue background on the left side and a white background on the right.
How to Use It
This layout serves to present quantitative findings in a research context, effectively combining textual and graphical elements. It fits well in a presentation sequence after introducing research questions or methodology, providing a clear visual representation of data. This slide is suitable for academic or professional settings where data analysis is discussed, such as presenting survey results, experimental data, or statistical findings. It can be used to summarize key results before drawing conclusions or recommendations.
Text Placeholders & Capacity
Keep your copy within these limits so it fits without resizing. Node labels can accommodate short phrases, roughly 2-3 words each.
| Placeholder | Count | Max characters (approx.) |
|---|---|---|
| Slide title | 1 | 30 |
| Subtitle | 1 | 50 |
| Item heading | 3 | 10 |
| Item body | 3 | 30 |
| Chart title | 1 | 30 |
Slide Keywords
Download unlimited PowerPoint templates, charts and graphics for your presentations with our annual plan.
DOWNLOADReturn to Free Research Paper PowerPoint Template.