Slide 1 of 1 from Free P&L Data-Driven PowerPoint Dashboard
Free P&L Data Driven PPT Dashboard Template
P&L Dashboard Overview - Data-Driven Insights
- Chart
- Dashboard Composite
- Financial Summary Slide
- 16:9
- 100% Editable
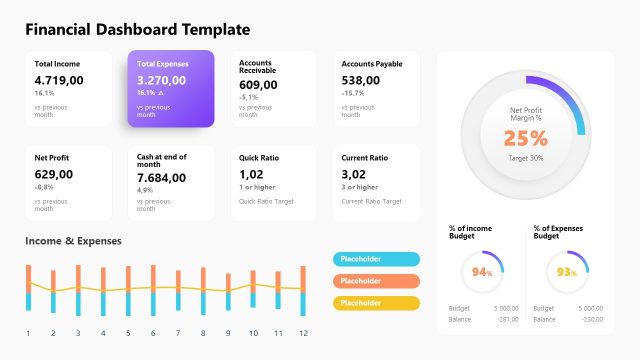
The P&L Dashboard Overview slide from the Free P&L Data-Driven PowerPoint Dashboard template provides a comprehensive financial summary, featuring distinct boxes for Revenue, Expenses, and Profit alongside trend graphs. This layout is ideal for business presentations focused on financial performance review and stakeholder updates, ensuring clarity in reporting key metrics and trends.
What’s on This Slide
The layout features a top section with three distinct boxes for Revenue, Expenses, and Profit, each containing numerical values and percentage changes. Below, two trend graphs illustrate Revenue and Expenses over time, with horizontal axes labeled by date. The Revenue box is positioned on the left, followed by Expenses on the right, and Profit in the center. Each box has a clear visual hierarchy, with larger font sizes for key figures and smaller for contextual information. Color coding indicates performance changes, while placeholders exist for the date at the top right.
How to Use It
This layout serves as a financial performance dashboard, ideal for presenting key metrics and trends in a business context. It fits well in a presentation sequence after an introductory slide, providing a data-driven overview of financial health. Use it to summarize monthly performance, compare current and past figures, or highlight significant changes in revenue and expenses. This structure is suitable for financial reviews, stakeholder meetings, or strategic planning sessions.
Text Placeholders & Capacity
Keep your copy within these limits so it fits without resizing. Node labels can accommodate roughly 2-3 words each.
| Placeholder | Count | Max characters (approx.) |
|---|---|---|
| Slide title | 1 | 20 |
| Item heading | 3 | 10 |
| Item body | 3 | 15 |
| Chart title | 2 | 15 |
| Date label | 1 | 10 |
Slide Keywords
Download unlimited PowerPoint templates, charts and graphics for your presentations with our annual plan.
DOWNLOADReturn to Free P&L Data-Driven PowerPoint Dashboard.