Slide 1 of 2 from Free Financial Dashboard PowerPoint Template
Free Financial Dashboard Presentation Template
Financial Dashboard Overview Slide
- Chart
- Dashboard Composite
- Financial Summary Slide
- 16:9
- 100% Editable
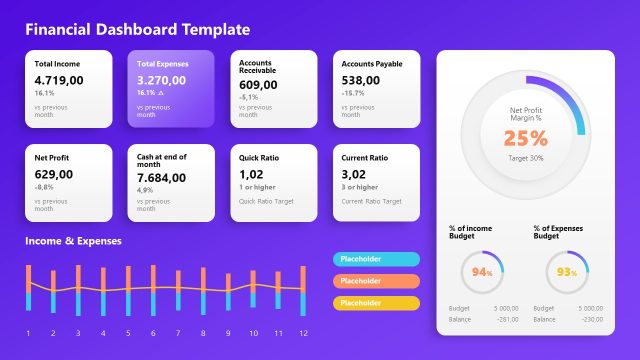
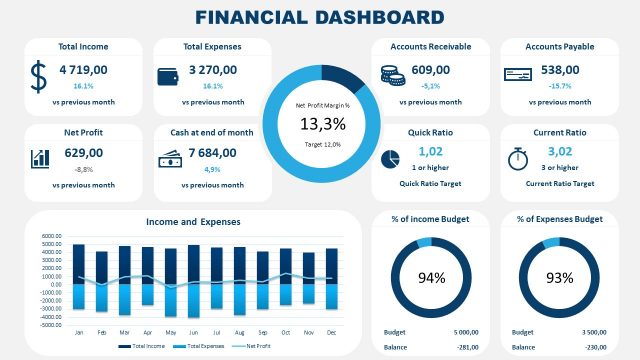
The Financial Dashboard Overview slide from the Free Financial Dashboard PowerPoint Template provides a comprehensive snapshot of key financial metrics. This layout is ideal for presenting financial performance reviews and monthly budget analyses, featuring a grid of visualizations and metrics such as Total Income and Net Profit. Stakeholders can quickly grasp essential data through engaging charts and gauges, making it a valuable addition to any corporate presentation.
What’s on This Slide
The layout features a grid of financial metrics and visualizations. At the top, a large title states 'Financial Dashboard Template.' Key metrics like 'Total Income,' 'Total Expenses,' and 'Net Profit' are displayed in rectangular boxes, with varying background colors for emphasis. A line graph at the bottom illustrates income and expenses over 12 months, with colored lines representing different data sets. Circular gauges show percentage metrics for 'Net Profit Margin' and budget comparisons. Several text placeholders are present for additional information.
How to Use It
This layout serves as a financial dashboard overview, summarizing key performance indicators. It fits well at the beginning of a financial presentation, providing a snapshot of financial health. Use it to present monthly financial summaries or budget reports. The layout is suitable for business meetings where quick insights into financial performance are needed, allowing stakeholders to grasp essential metrics at a glance.
Text Placeholders & Capacity
Keep your copy within these limits so it fits without resizing. Node labels can hold about 20 characters each, while body paragraphs are tighter at around 40 characters.
| Placeholder | Count | Max characters (approx.) |
|---|---|---|
| Slide title | 1 | 30 |
| Item heading | 12 | 20 |
| Body paragraph | 6 | 40 |
Slide Keywords
Download unlimited PowerPoint templates, charts and graphics for your presentations with our annual plan.
DOWNLOADReturn to Free Financial Dashboard PowerPoint Template.