Slide 5 of 8 from Free Modern Professional Slides for PowerPoint
Pie Chart Design for PowerPoint
Quarterly Performance Overview Slide
- Chart
- Pie Chart
- Evaluation Slide
- 16:9
- 100% Editable
The Quarterly Performance Overview slide from the Free Modern Professional Slides for PowerPoint template presents a pie chart with five segments to clearly visualize business metrics across quarters. This slide layout is ideal for corporate presentations requiring an organized financial summary or quarterly performance review. With editable shapes and vector icons aligned to detailed text placeholders, it supports effective communication in business presentations and pitch deck templates.
About This Slide
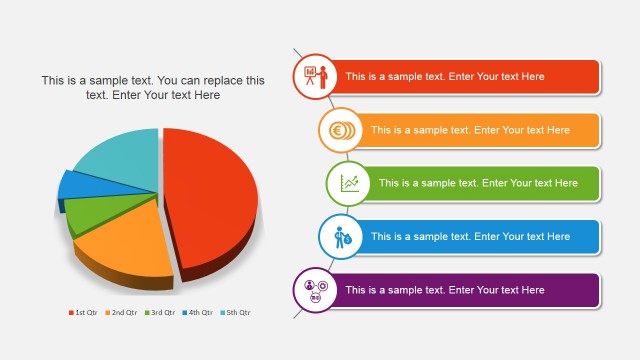
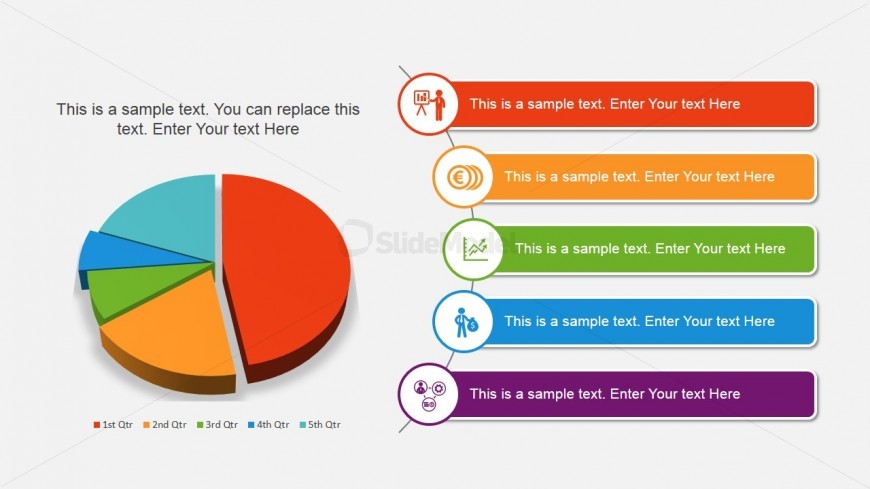
This chart slide is designed to help presenters make a pie chart more interactive and visually-appealing in Microsoft PowerPoint. The Office template features a multi-colored pie chart which can accommodate five different elements. These elements can be identified through the legend below the pie chart. A description of the PowerPoint slide may be placed in the text placeholder above the pie chart. The slide design also contains five generic icons which correspond to the similarly-colored elements in the PowerPoint pie chart. The icons are accompanied by text placeholders where a description of each element may be inserted. All PowerPoint graphics are 100% editable and may be modified according to the presenter’s preference.
What’s on This Slide
The layout features a pie chart positioned on the left side, displaying five segments in different colors. Each segment represents a quarter, labeled with corresponding colors. To the right, there are five text placeholders arranged vertically, each aligned with a colored icon above it. The icons represent various business concepts. The top placeholder is larger and serves as a title, while the others are smaller and provide additional details. The background is light, enhancing the visibility of the chart and text. The overall composition is balanced, with clear visual hierarchy.
How to Use It
This layout serves as a quarterly performance overview, effectively illustrating data distribution across five segments. It fits well in a business presentation, particularly after introducing performance metrics or financial results. This structure is useful for summarizing quarterly achievements, trends, or forecasts. It can be employed in meetings to discuss strategic planning or financial reviews, providing a clear visual representation of data. The layout can also support discussions on future objectives based on past performance.
Text Placeholders & Capacity
Keep your copy within these limits so it fits without resizing. Node labels can accommodate roughly 5-6 words each.
| Placeholder | Count | Max characters (approx.) |
|---|---|---|
| Slide title | 1 | 50 |
| Item heading | 5 | 30 |
| Item body | 5 | 50 |
Slide Keywords
Download unlimited PowerPoint templates, charts and graphics for your presentations with our annual plan.
DOWNLOAD