Slide 3 of 5 from Free Filtering Process Diagram Template for PowerPoint
Free Filtering Process Diagram Presentation Slide
Filtering Process Diagram Slide Template
- Diagram
- Process Flow
- Process Slide
- 16:9
- 100% Editable
What’s on This Slide
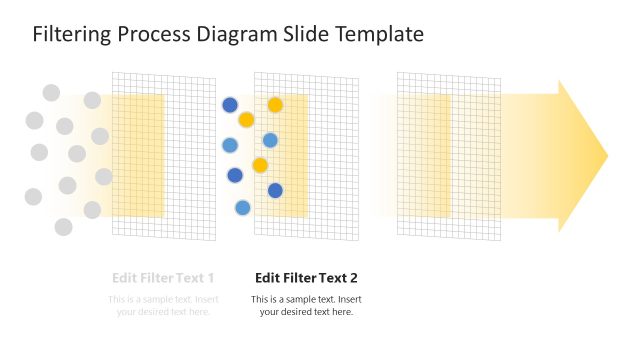
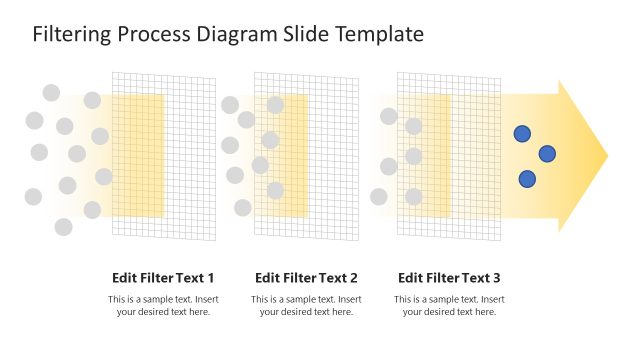
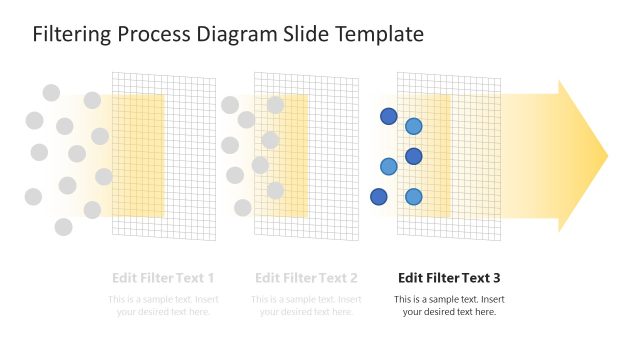
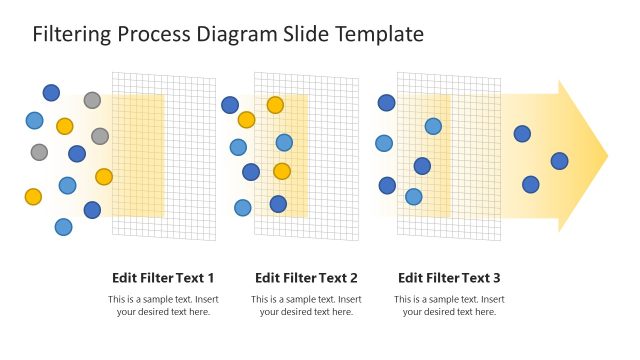
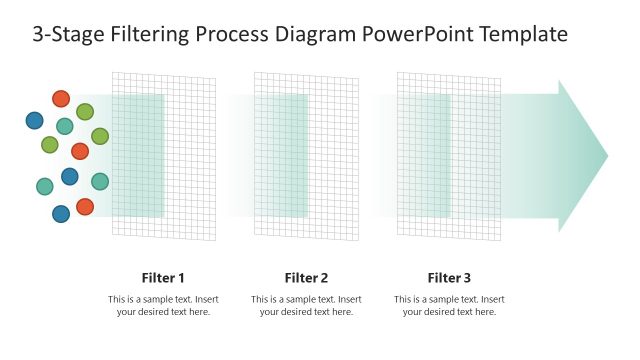
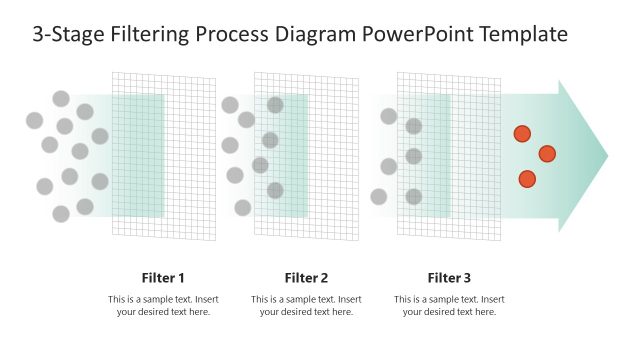
The slide features a horizontal filtering process diagram with three sections. On the left, colored circles represent input elements. The center contains three grid-like shapes with yellow backgrounds, indicating filtering stages. Each grid is slightly transparent, allowing some overlap with the circles. An arrow points to the right, indicating the flow of the process. Text placeholders are positioned above and below the diagram, with the title at the top center and a body text placeholder below. The overall layout is clean and organized, emphasizing the filtering concept.
How to Use It
This layout serves as a visual representation of a filtering process, ideal for illustrating stages of selection or refinement. It fits well in presentations discussing workflows, decision-making processes, or product development steps. The diagram can be used in business contexts where filtering information or options is necessary, such as project management or data analysis. It is particularly useful for explaining complex processes in a simplified manner, making it accessible for various audiences.
Text Placeholders & Capacity
Keep your copy within these limits so it fits without resizing. Body text slots can hold approximately 15-20 words each.
| Placeholder | Count | Max characters (approx.) |
|---|---|---|
| Slide title | 1 | 30 |
| Body paragraph | 1 | 100 |
Slide Keywords
Download unlimited PowerPoint templates, charts and graphics for your presentations with our annual plan.
DOWNLOADReturn to Free Filtering Process Diagram Template for PowerPoint.