Free Crosstabs Slide Template for PowerPoint
Download Free Crosstabs Slide Template for PowerPoint & Google Slides
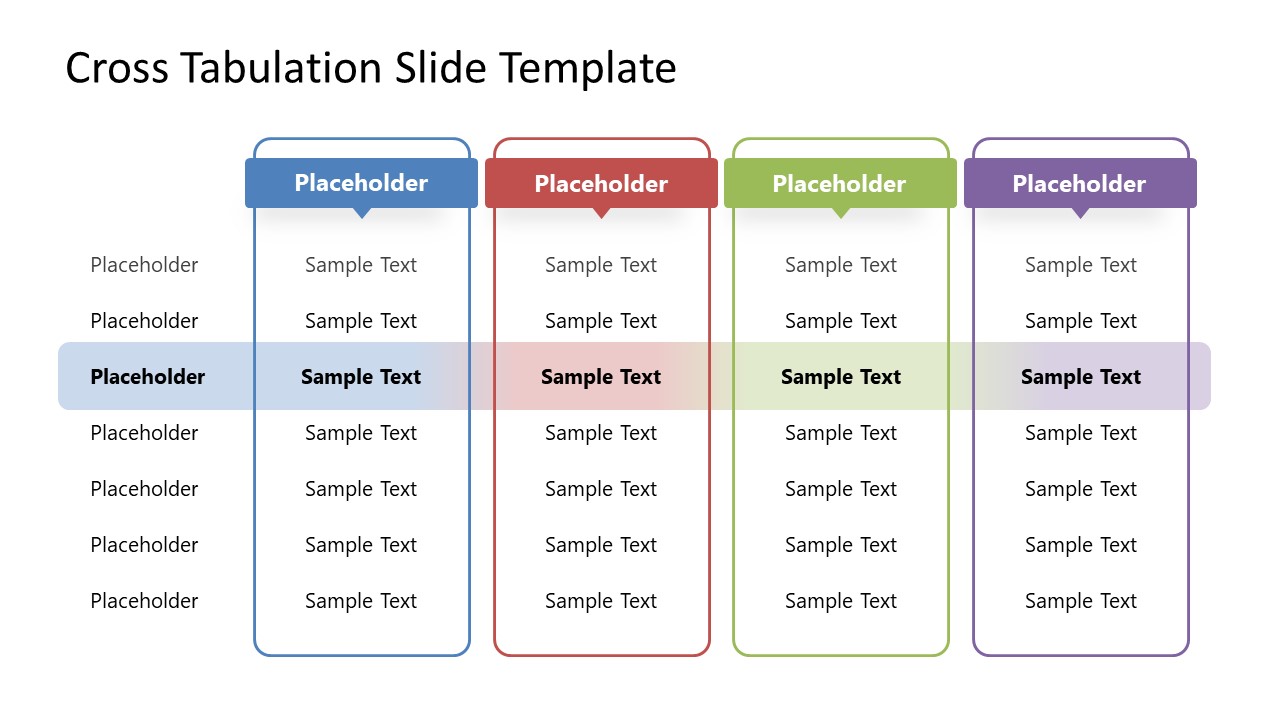
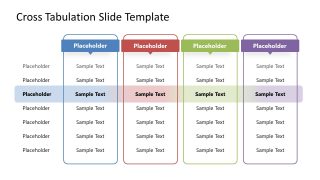
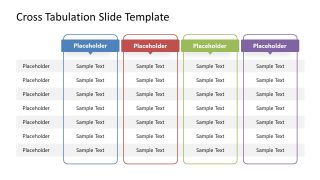
Download the Free Crosstabs Slide Template for PowerPoint to present the relationship between variables in your data analysis and summarization presentations. A crosstab or crosstabulation diagram is a statistical tool for comparing data variables and finding their relationship or interdependencies. It is used in diverse fields like education, market research, data analytics, and business to understand the links among the variable factors. The rows and columns of this diagram indicate the variables’ levels or categories, and the cells carry observed percentages showing the variables’ coherence. We have created this easy-to-edit free crosstab PowerPoint template using shapes and engaging effects. Presenters can download this free PowerPoint template and prepare presentations on statistical topics.
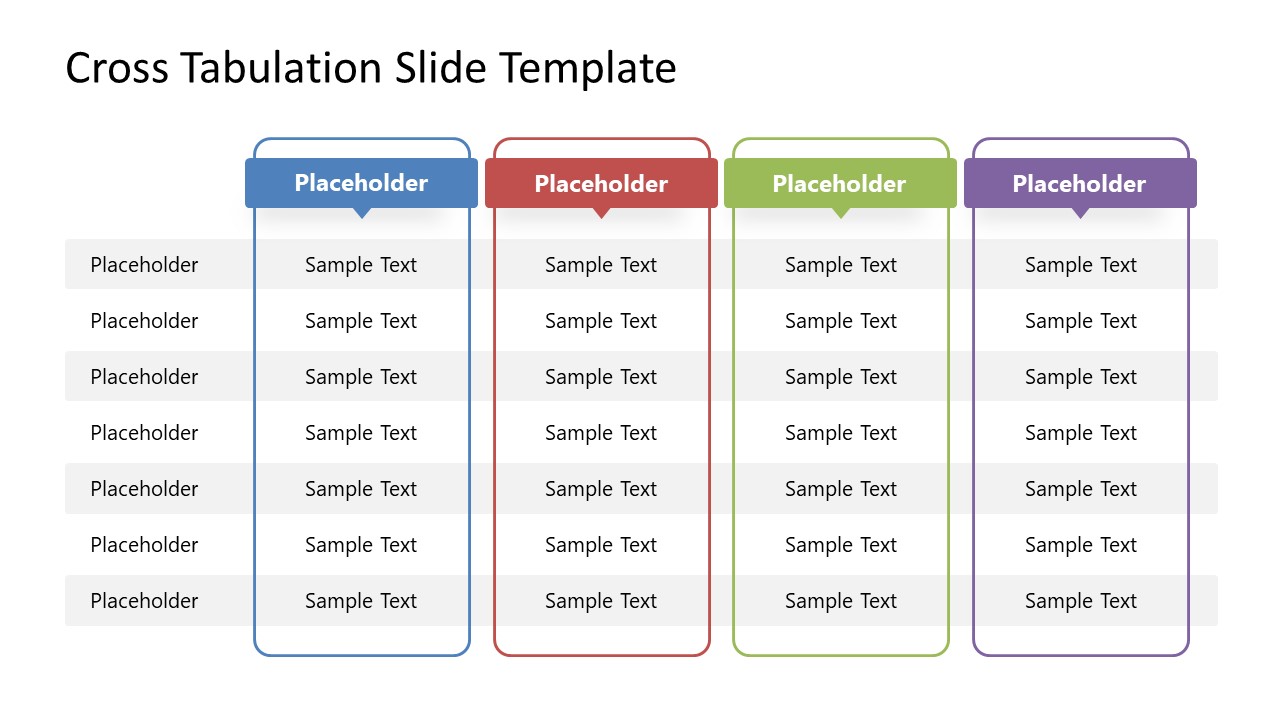
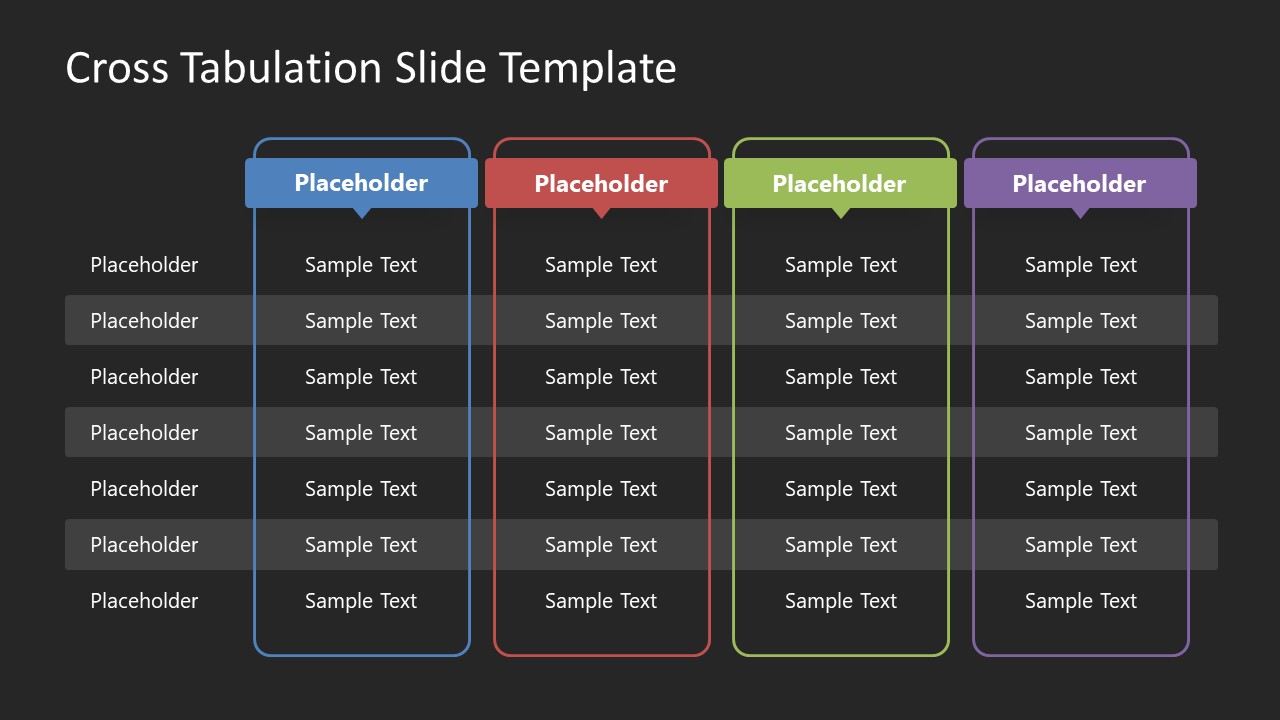
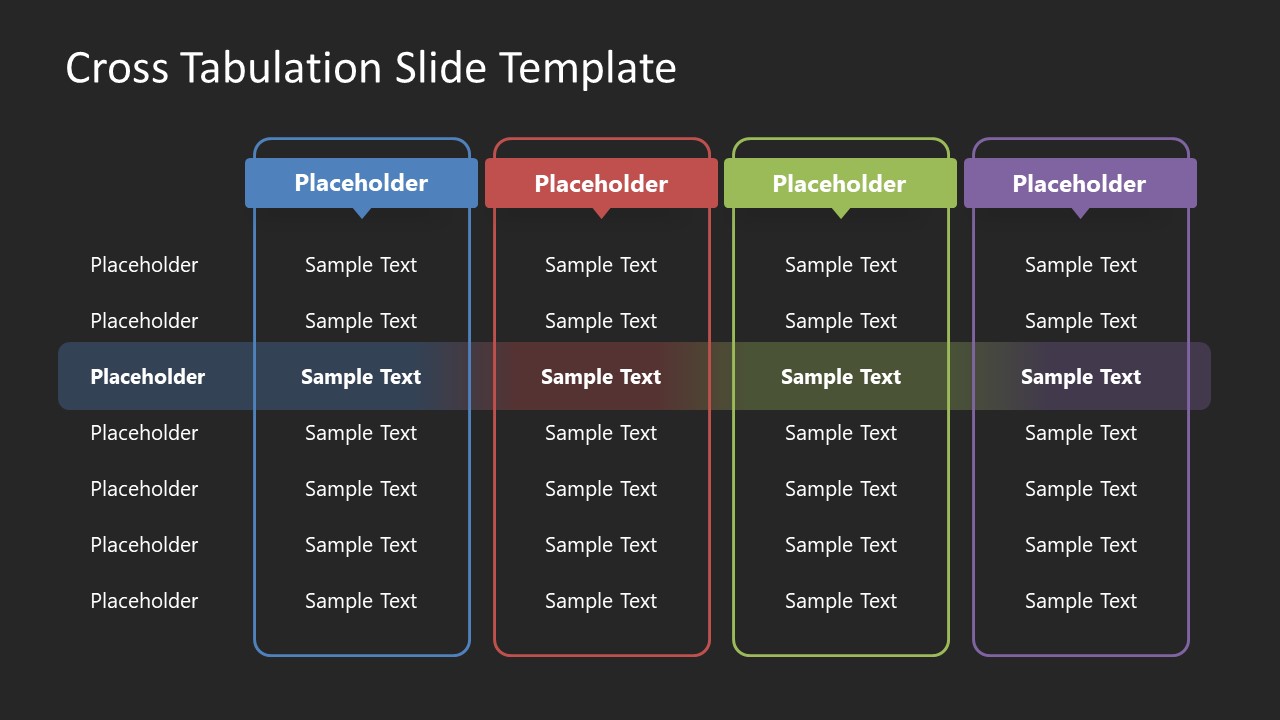
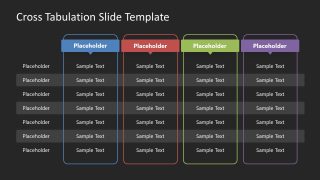
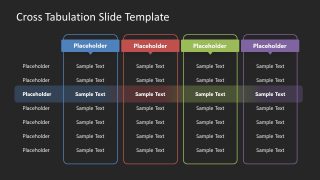
This Free Crosstabs Slide Template for PowerPoint carries two slide layouts, each added in two background color variations. The first slide has a 4×7 table diagram with a thin, colorful outline surrounding each column and simple rows. Editable text boxes are provided in the place of cells and titles. The title labels are color-filled, which can be changed accordingly. A light-colored overlayer can highlight a specific relationship or dependency on a specific row of this table diagram. Users can change their location, duplicate, or delete based on the presented data. Likewise, the following slide has an alternate pattern of color shades on each row. These PowerPoint slides are also provided with a dark background color. So, users can choose from these free crosstabs for PowerPoint slides and prepare engaging presentations by inserting the required data. Users can edit this template with PowerPoint, Google Slides, and Keynote software. Try it now!
FEATURES
- 100% Editable PowerPoint Templates & Google Slides.
- Compatible with all major Microsoft PowerPoint versions, Keynote and Google Slides.
- Modern 16:9 Aspect Ratio.
- Scalable Vectorial PowerPoint Shapes and PowerPoint Icons.
- Instant Access and Download.
- New Templates every week.
Google Slides Preview
Our PowerPoint Templates are compatible with Google Slides. Take the most of every platform using the tool you like.
