Slide 12 of 15 from Free Aquarelle PowerPoint Background
Data Driven Bar Chart Slide with Aquarelle Background
Bar Chart Slide for Presentations
- Chart
- Bar Vertical
- Evaluation Slide
- 16:9
- 100% Editable
What’s on This Slide
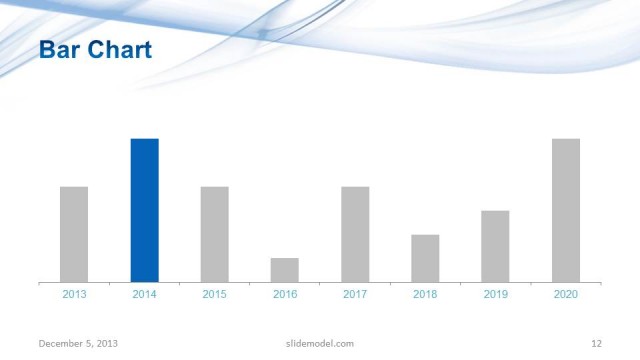
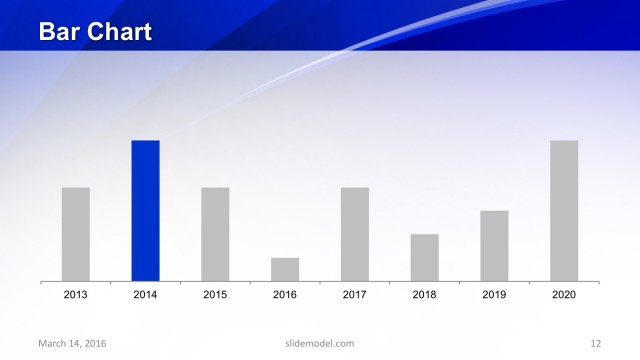
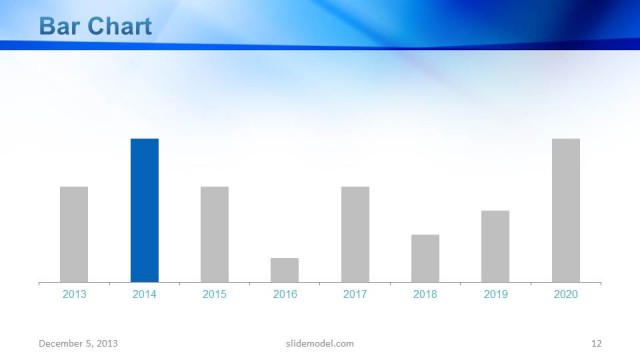
The slide features a bar chart positioned centrally, displaying data across the years 2015 to 2023. The chart includes vertical bars, with the bar for 2016 highlighted in blue, while the others are in gray. The x-axis labels the years, and the y-axis represents the values, though specific values are not shown. Above the chart, there is a bold title stating 'Bar Chart.' The background is predominantly white, with a colorful watercolor gradient at the bottom, creating a visually engaging contrast. Text placeholders exist for additional annotations.
How to Use It
This layout serves as a data visualization tool, ideal for presenting comparisons over time. It fits well in a business presentation sequence, particularly after introducing trends or data points. This slide is useful for showcasing annual performance metrics, sales growth, or any time-based data analysis. It can be used in meetings to discuss yearly results or strategic planning sessions to illustrate progress over time. The layout emphasizes a single data point while providing context through the surrounding years.
Text Placeholders & Capacity
Keep your copy within these limits so it fits without resizing. Node labels can accommodate roughly 8 characters each without overflow.
| Placeholder | Count | Max characters (approx.) |
|---|---|---|
| Slide title | 1 | 20 |
| Item heading | 8 | 10 |
Slide Keywords
Download unlimited PowerPoint templates, charts and graphics for your presentations with our annual plan.
DOWNLOADReturn to Free Aquarelle PowerPoint Background.