Slide 12 of 15 from Free White Textured PowerPoint Background
Bar Graph for PowerPoint White Texture Background Template
Bar Chart Slide for Presentations
- Chart
- Bar Vertical
- Evaluation Slide
- 16:9
- 100% Editable
What’s on This Slide
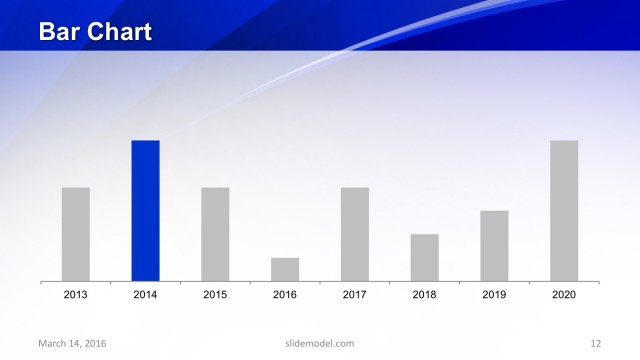
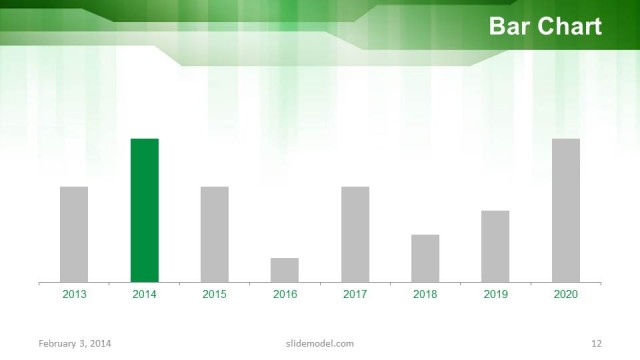
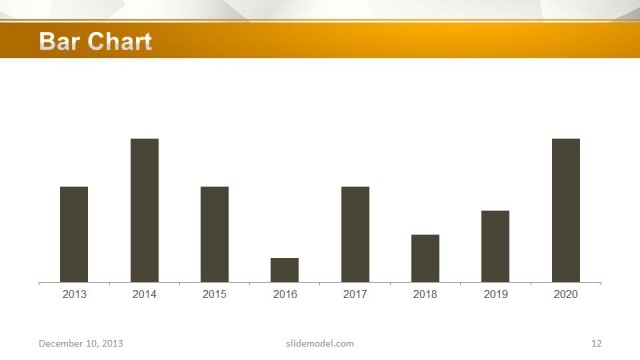
The slide features a horizontal bar chart positioned centrally. The chart displays vertical bars representing data for the years 2015 to 2023. The bar for 2016 is highlighted in a bright green color, while the other bars are in dark gray. Each bar is evenly spaced along the horizontal axis, with year labels positioned below each corresponding bar. The title 'Bar Chart' is placed prominently at the top in bold, large font. There are no additional images or media placeholders present on the slide.
How to Use It
This layout serves as a data visualization tool, ideal for presenting comparative data over time. It fits well in a sequence following introductory slides or problem statements, effectively illustrating trends or changes. This slide is suitable for business presentations, financial reports, or performance reviews where clear data representation is essential. It can also be used in educational contexts to explain statistical information or trends in research findings.
Text Placeholders & Capacity
Keep your copy within these limits so it fits without resizing. Node labels can hold up to 4 characters each.
| Placeholder | Count | Max characters (approx.) |
|---|---|---|
| Slide title | 1 | 20 |
| Item heading | 8 | 4 |
Slide Keywords
Download unlimited PowerPoint templates, charts and graphics for your presentations with our annual plan.
DOWNLOADReturn to Free White Textured PowerPoint Background.