Slide 5 of 8 from Business Work PowerPoint Diagrams
Free Editable World Map Demographic Slides
Geographic Data Representation Slide
- Map
- Country Map
- Data Findings Slide
- 16:9
- 100% Editable
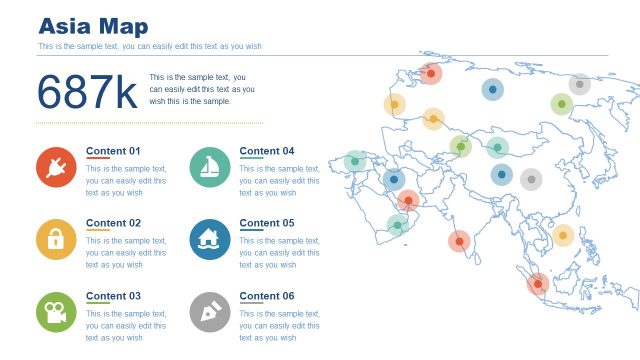
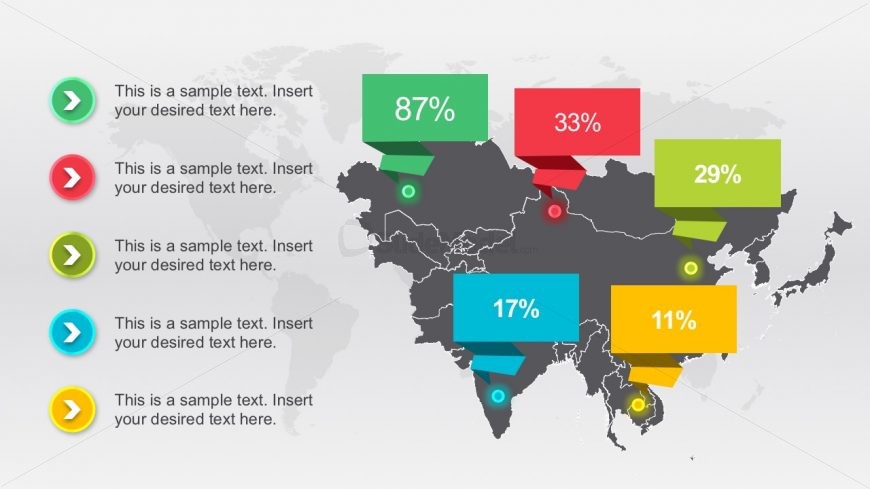
The Geographic Data Representation slide from the Business Work PowerPoint Diagrams template offers a clear visual of regional statistics using editable shapes and vector icons on a map of Asia. This slide layout supports market analysis and demographic studies by highlighting comparative data across geographic areas, making it a practical choice for corporate presentations and business presentation slide decks.
What’s on This Slide
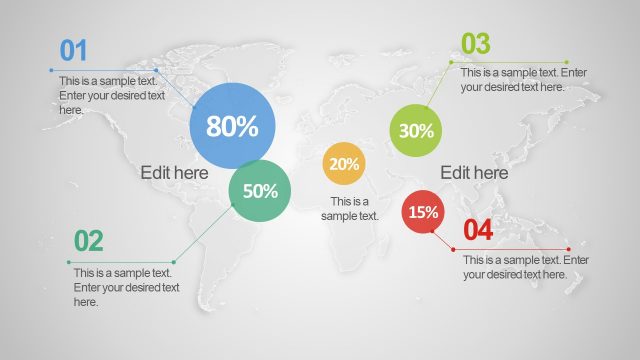
The slide features a dark gray map of Asia with several colored callout boxes positioned over specific regions. Each callout box contains a percentage figure and a text placeholder for additional information. The callouts are in various colors: green, red, blue, yellow, and orange, with arrows pointing to their respective locations on the map. The text placeholders are aligned centrally within the boxes, which vary in size. The overall layout emphasizes the geographic distribution of data, with a clean background enhancing visibility.
How to Use It
This layout serves to visually represent data across geographic regions, making it suitable for presentations on market analysis, demographic studies, or regional performance metrics. It is effective in illustrating comparative statistics, such as survey results or sales figures, across different areas. This slide fits well in a sequence following a problem statement, providing a visual context for data-driven discussions or strategic planning.
Text Placeholders & Capacity
Keep your copy within these limits so it fits without resizing. Node body slots can hold about 40 characters each.
| Placeholder | Count | Max characters (approx.) |
|---|---|---|
| Item body | 5 | 40 |
Slide Keywords
Download unlimited PowerPoint templates, charts and graphics for your presentations with our annual plan.
DOWNLOADReturn to Business Work PowerPoint Diagrams.