Slide 9 of 9 from Free Animated Editable Professional Infographics PowerPoint Template
Animated Business Line Chart Template
Infographic Slide with Data and Icons
- Chart
- Line Chart
- Statistics Slide
- 16:9
- 100% Editable
The Infographic with Data Visualization slide from the Free Animated Editable Professional Infographics PowerPoint Template offers a clear layout for presenting business metrics and marketing insights. This slide combines editable shapes, vector icons, and a line chart to enhance data comprehension, making it a practical choice for corporate presentations and slide decks focused on statistical analysis.
What’s on This Slide
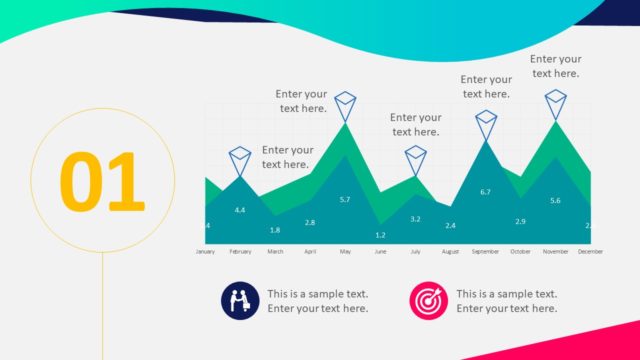
The layout features a large title at the top left, labeled '07,' followed by a prominent statistic, '26 Million,' centered below. To the right, three colored icons represent different categories, each accompanied by a text placeholder below. A line chart occupies the lower section, displaying two data series in blue and yellow with monthly labels along the x-axis. Below the chart, three horizontal bar indicators illustrate percentage values for three items, each with associated icons. The background is light gray, enhancing the visibility of the elements.
How to Use It
This layout serves as a data presentation slide, effectively showcasing key metrics and visual data. It fits well in a sequence where data insights follow an introduction or overview. Real-world applications include business reports, marketing presentations, or performance reviews, where clear data visualization is essential. The combination of icons and charts allows for quick comprehension of complex information, making it suitable for engaging audiences in various professional contexts.
Text Placeholders & Capacity
Keep your copy within these limits so it fits without resizing. Body slots are tight, roughly 15 words each.
| Placeholder | Count | Max characters (approx.) |
|---|---|---|
| Slide title | 1 | 2 |
| Body paragraph | 1 | 15 |
| Item heading | 3 | 10 |
| Item body | 3 | 15 |
| Chart title | 1 | 30 |
Slide Keywords
Download unlimited PowerPoint templates, charts and graphics for your presentations with our annual plan.
DOWNLOADReturn to Free Animated Editable Professional Infographics PowerPoint Template.