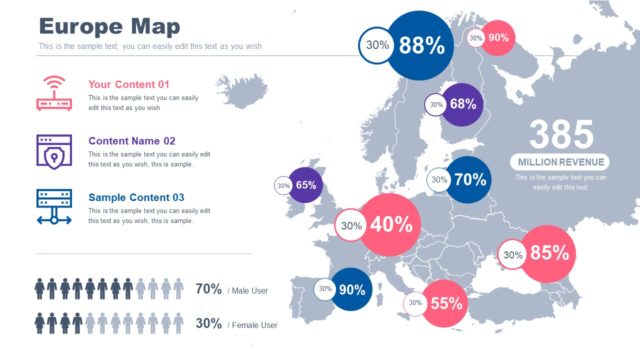
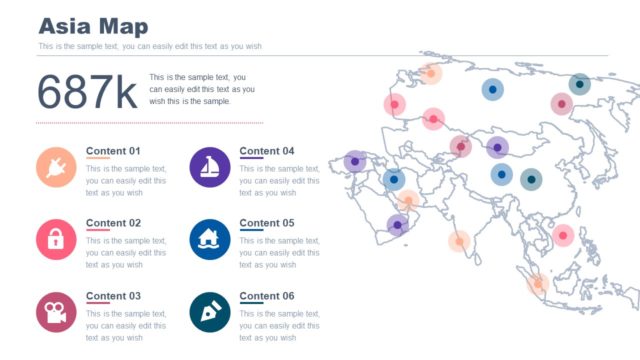
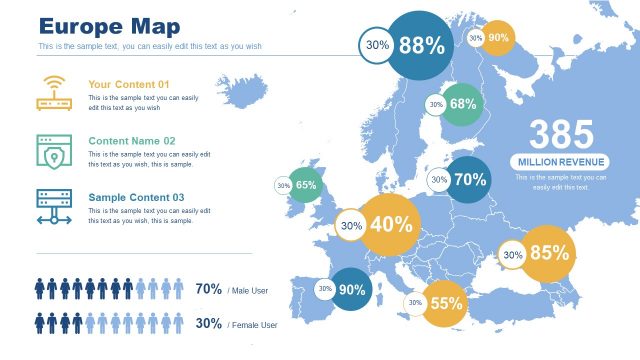
Slide 29 of 29 from #2 Maps Bundle PowerPoint Template
30011-01-maps-bundle-powerpoint-28
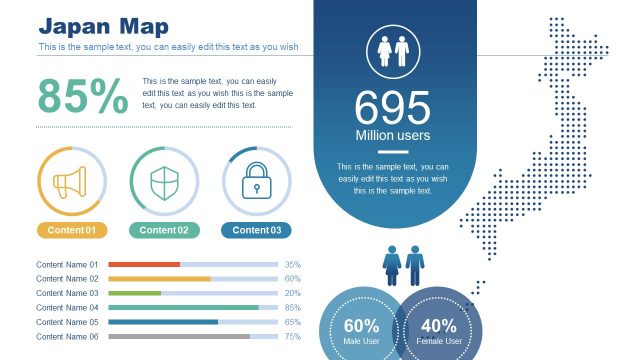
Japan Map with User Statistics Slide
- Map
- Country Map
- Context Slide
- 16:9
- 100% Editable
The Japan Map with User Statistics slide from the #2 Maps Bundle PowerPoint Template offers a clear visual layout combining geographic data and user demographics. This slide template is ideal for business presentations focusing on market analysis and regional user engagement, featuring editable shapes and vector icons to customize statistics and content categories effectively.
What’s on This Slide
The layout features a map of Japan positioned on the right side, with a dotted pattern. To the left, there are three circular icons representing different content categories, each accompanied by a label. Above the map, a large percentage figure is displayed prominently. Below this, a statistic regarding user count is shown in a larger font. Additional text placeholders are present for content names and percentages, arranged vertically. The overall color scheme includes shades of blue and pink, creating a clear visual hierarchy.
How to Use It
This layout serves to present geographic data alongside user statistics, making it suitable for market analysis or demographic presentations. It fits well in a sequence after introducing a geographic context or before discussing user engagement strategies. This structure is useful for businesses looking to highlight specific regional data and user demographics in presentations.
Text Placeholders & Capacity
Keep your copy within these limits so it fits without resizing. Body slots can accommodate roughly 5-6 words each.
| Placeholder | Count | Max characters (approx.) |
|---|---|---|
| Slide title | 1 | 30 |
| Body paragraph | 1 | 100 |
| Item heading | 3 | 20 |
| Item body | 6 | 50 |
| Kpi value | 1 | 20 |
| Kpi caption | 1 | 30 |
Slide Keywords
Download unlimited PowerPoint templates, charts and graphics for your presentations with our annual plan.
DOWNLOADReturn to #2 Maps Bundle PowerPoint Template.