Slide 19 of 29 from #2 Maps Bundle PowerPoint Template
30011-01-maps-bundle-powerpoint-18
Editable Europe Map with Revenue Statistics
- Map
- Country Map
- Statistics Slide
- 16:9
- 100% Editable
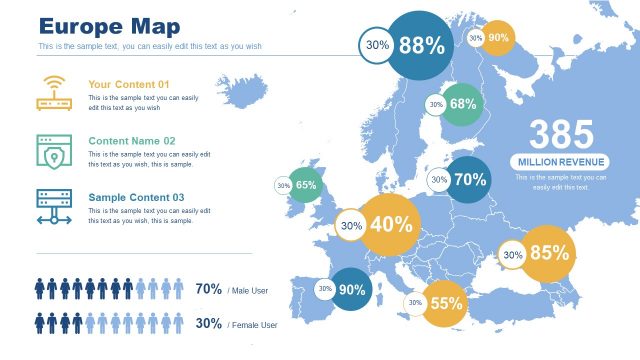
The Europe Map with Revenue Data slide from the #2 Maps Bundle PowerPoint Template offers a clear geographic visualization ideal for business presentations focused on market analysis and regional performance. This slide template includes editable shapes and vector icons to highlight demographic insights and revenue figures across European regions, supporting effective communication in corporate presentations and pitch decks.
What’s on This Slide
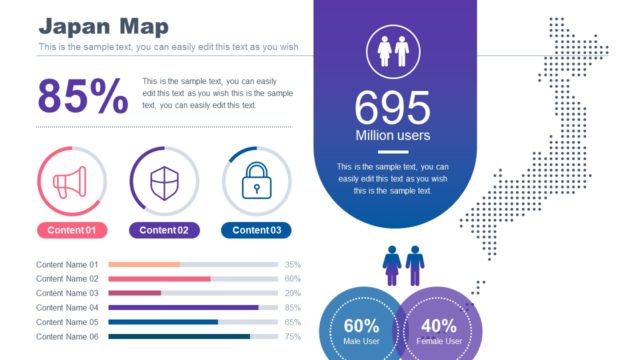
The slide features a map of Europe with various regions highlighted by circular nodes displaying percentages. The map occupies the center, with the title 'Europe Map' at the top. Below the map, three text placeholders are aligned vertically on the left, each containing sample text for content descriptions. A revenue figure of '385 Million' is prominently displayed in the center. At the bottom, icons representing male and female users are shown alongside percentage figures, indicating demographic data. The overall layout is clean, with a light background and colorful nodes.
How to Use It
This layout serves as a geographic representation of data, suitable for illustrating market analysis or demographic insights. It fits well in a presentation sequence following a problem slide and before a solution or strategy slide. This structure is beneficial for businesses analyzing regional performance, market segmentation, or user demographics. It can be used to present revenue data across different European countries, making it effective for sales and marketing discussions.
Text Placeholders & Capacity
Keep your copy within these limits so it fits without resizing. Body slots can accommodate roughly 10-12 words each.
| Placeholder | Count | Max characters (approx.) |
|---|---|---|
| Slide title | 1 | 30 |
| Body paragraph | 4 | 60 |
| Item heading | 10 | 10 |
| Statistic value | 1 | 20 |
Slide Keywords
Download unlimited PowerPoint templates, charts and graphics for your presentations with our annual plan.
DOWNLOADReturn to #2 Maps Bundle PowerPoint Template.