Slide 16 of 32 from #2 Editable Data Driven Maps Bundle
Africa Editable PowerPoint Maps
Population Data for Africa Slide
- Text Layout
- Single Statement
- Context Slide
- 16:9
- 100% Editable
The Population Data for Africa slide from the #2 Editable Data Driven Maps Bundle offers a clear layout for demographic presentations and market research reports. Featuring editable shapes and vector icons, this slide template supports detailed geographic analysis within business presentations or educational contexts. Its design integrates population statistics with visual progress indicators, making it a practical choice for slide decks focusing on regional data insights.
What’s on This Slide
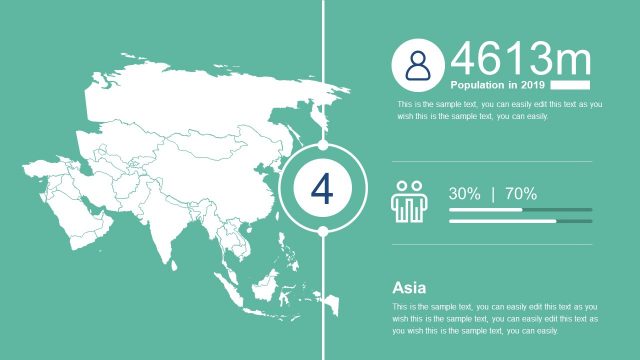
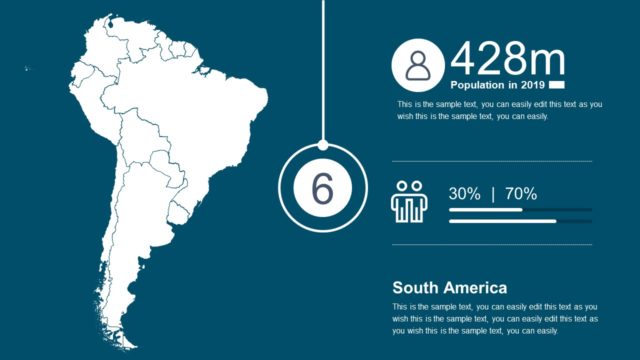
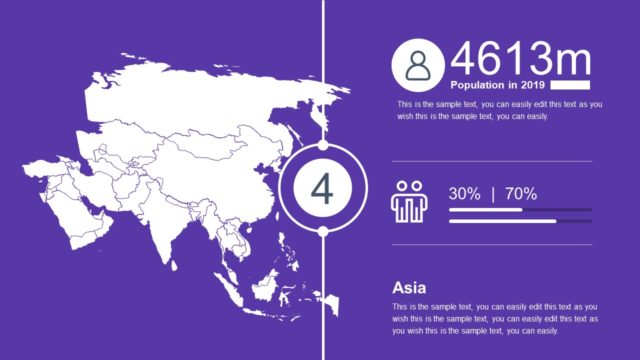
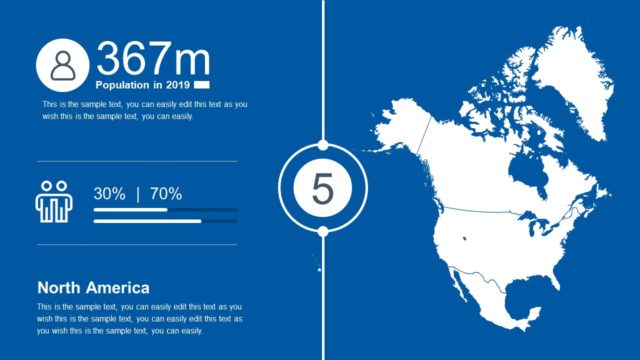
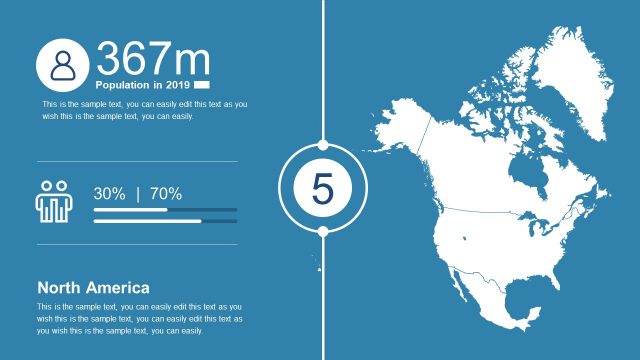
The slide features a green background with a right-aligned map of Africa. On the left, there is a circular icon representing population, with the text '1317m Population in 2019' directly beneath it. Below this, two figures are displayed as a percentage, '30% | 70%', accompanied by a horizontal progress bar. The central area contains a large number '3' in a circle. At the bottom, the label 'Africa' is present, followed by a text placeholder for additional information. Text placeholders are consistently aligned and visually distinct.
How to Use It
This layout serves to present demographic data, specifically focusing on population statistics for Africa. It fits into a presentation sequence that discusses regional demographics or geographic comparisons. This structure is useful for analysts reporting on population trends, educators teaching geography, or business professionals assessing market potential in Africa. It can be utilized in various contexts where demographic insights are required.
Text Placeholders & Capacity
Keep your copy within these limits so it fits without resizing. Body slots can accommodate about 25-30 words each.
| Placeholder | Count | Max characters (approx.) |
|---|---|---|
| Slide title | 1 | 30 |
| Body paragraph | 3 | 150 |
| Item heading | 1 | 10 |
| Item body | 1 | 50 |
Slide Keywords
Download unlimited PowerPoint templates, charts and graphics for your presentations with our annual plan.
DOWNLOADReturn to #2 Editable Data Driven Maps Bundle.