Slide 17 of 29 from #2 Maps Bundle PowerPoint Template
30011-01-maps-bundle-powerpoint-16
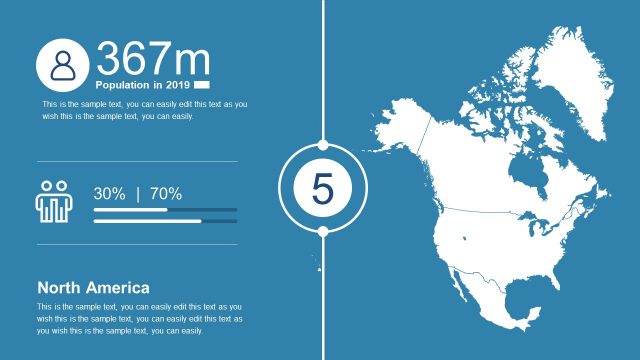
North America Population Overview Slide
- Map
- Country Map
- Context Slide
- 16:9
- 100% Editable
The North America Population Overview slide from the #2 Maps Bundle PowerPoint Template offers a clear visual context for demographic analysis and market overview. Featuring editable slides with a detailed map and population statistics, it supports corporate presentations and business presentation needs focused on regional comparison and population trends.
What’s on This Slide
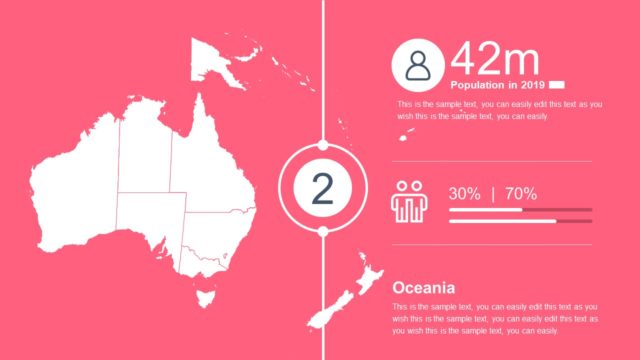
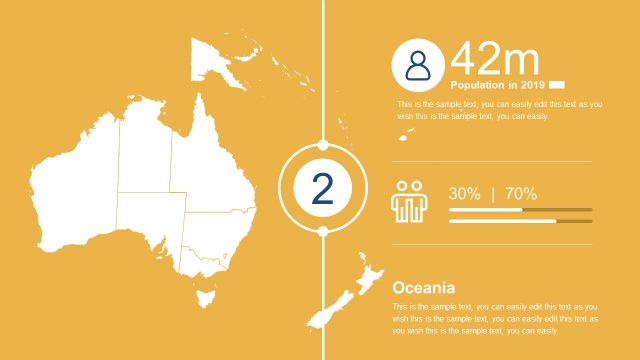
The layout features a blue background with a prominent white map of North America on the right. On the left, there is a circular icon representing population statistics, with the text '367m Population in 2019' below it. A horizontal bar graph displays two percentages, '30%' and '70%', accompanied by a person icon. Below this, the label 'North America' is prominently displayed, followed by a text placeholder for additional information. The overall composition emphasizes the map and key statistics, creating a clear visual hierarchy.
How to Use It
This layout serves to present demographic data focused on North America, making it suitable for discussions on regional markets or population trends. It fits well in a presentation sequence following a general overview or problem framing slide. This format can be used in business contexts such as market analysis, regional planning, or demographic studies, where visual representation of population data is essential.
Text Placeholders & Capacity
Keep your copy within these limits so it fits without resizing. Body slots are tight, roughly 10-15 words each.
| Placeholder | Count | Max characters (approx.) |
|---|---|---|
| Slide title | 1 | 30 |
| Body paragraph | 3 | 100 |
| Item heading | 1 | 10 |
| Item body | 1 | 50 |
| Kpi value | 1 | 10 |
| Kpi caption | 1 | 30 |
Slide Keywords
Download unlimited PowerPoint templates, charts and graphics for your presentations with our annual plan.
DOWNLOADReturn to #2 Maps Bundle PowerPoint Template.