Slide 48 of 51 from #3 Ultimate Pitch Deck PowerPoint Template
7757-01-ultimate-pitch-deck-powerpoint-template-16×9-48
Financial Table for Business Overview
- Table
- Data Table
- Financial Summary Slide
- 16:9
- 100% Editable
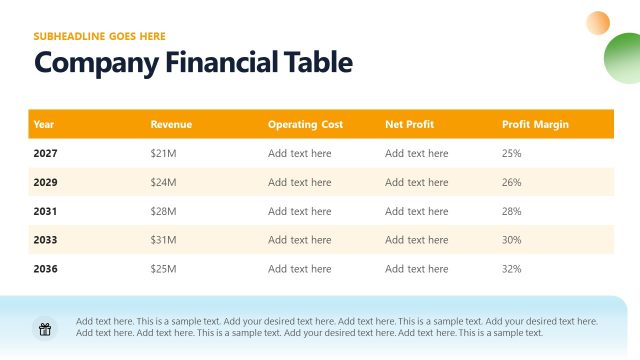
The Financial Table slide from the #3 Ultimate Pitch Deck PowerPoint Template offers a clear layout combining a horizontal bar chart with a detailed data table, ideal for financial forecasting and budget presentations. This slide template integrates editable shapes and vector icons to enhance clarity and visual hierarchy, making it suitable for corporate presentations and investment proposals within professional slide decks.
What’s on This Slide
The layout features a horizontal bar chart positioned at the top, displaying four bars in varying lengths and colors, with a horizontal axis labeled with numbers from 0 to 14. Below the chart is a table containing five rows and five columns. The first row serves as the header, with the years 2019 to 2023 labeled in blue. The subsequent rows contain sample text in the first column and numerical values in the remaining columns. Text placeholders are centered in the table cells, emphasizing a clear visual hierarchy. The overall background is white, enhancing readability.
How to Use It
This layout serves as a financial overview, effectively displaying data trends over multiple years alongside detailed numerical information. It fits well in a presentation sequence after discussing market analysis or product performance. This structure is useful for business scenarios such as financial forecasting, budget presentations, or investment proposals, where clarity in data representation is crucial for decision-making.
Text Placeholders & Capacity
Keep your copy within these limits so it fits without resizing. Table cells can accommodate roughly 2-3 words each.
| Placeholder | Count | Max characters (approx.) |
|---|---|---|
| Chart title | 1 | 20 |
| Column header | 5 | 10 |
| Cell | 20 | 15 |
Slide Keywords
Download unlimited PowerPoint templates, charts and graphics for your presentations with our annual plan.
DOWNLOADReturn to #3 Ultimate Pitch Deck PowerPoint Template.