Slide 50 of 51 from #3 Ultimate Pitch Deck PowerPoint Template
7757-01-ultimate-pitch-deck-powerpoint-template-16×9-47
Financial Table for Business Overview
- Table
- Data Table
- Financial Summary Slide
- 16:9
- 100% Editable
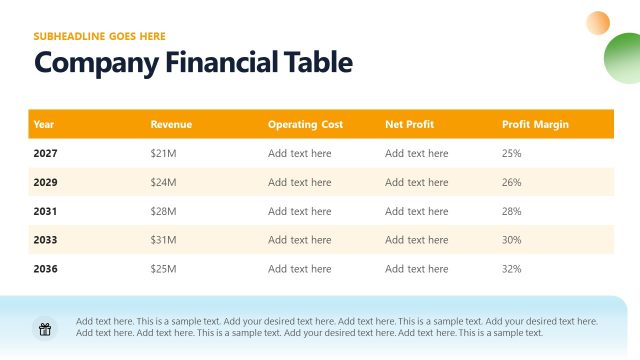
The Financial Table slide from the #3 Ultimate Pitch Deck PowerPoint Template provides a clear and organized layout for presenting multi-year financial data. This slide template is well-suited for business presentations requiring detailed budget overviews and performance tracking. Its structured table design with editable shapes ensures easy customization, making it a practical choice for corporate presentations and pitch decks that demand precise financial summaries.
What’s on This Slide
The layout features a structured table positioned centrally on the slide. The table has five columns labeled with years from 2019 to 2023, with a header row in blue. Each row contains sample text placeholders, with the last row labeled 'Total' also highlighted in blue. The table consists of multiple rows, with varying amounts of sample data. The overall composition is clean and organized, emphasizing the financial data. The background is light, enhancing readability, while the header row uses a contrasting color for visual hierarchy.
How to Use It
This layout serves as a financial overview, ideal for presenting numerical data across multiple years. It fits well in a presentation sequence following sections on market analysis or product performance. This table can be used in business scenarios such as budget presentations, financial forecasts, or performance reviews, allowing stakeholders to quickly grasp key financial metrics and trends over time.
Text Placeholders & Capacity
Keep your copy within these limits so it fits without resizing. Cell slots are tight, roughly 10 characters each.
| Placeholder | Count | Max characters (approx.) |
|---|---|---|
| Chart title | 1 | 20 |
| Cell | 50 | 10 |
| Row label | 10 | 15 |
| Column header | 5 | 10 |
Slide Keywords
Download unlimited PowerPoint templates, charts and graphics for your presentations with our annual plan.
DOWNLOADReturn to #3 Ultimate Pitch Deck PowerPoint Template.