
Power BI has become a commonly used tool for analytics, dashboards, and interactive reporting. But when it’s time to present insights to executives, clients, or investors, most teams still rely on PowerPoint. For that reason, the ability to convert Power BI to PowerPoint is essential for analysts, managers, and anyone preparing strategic presentations.
This guide walks you through practical methods for turning Power BI content into PowerPoint slides. In what is to follow, you’ll learn how to export complete reports and individual visuals, embed live dashboards, troubleshoot common issues, and optimize the design of your Power BI data slides.
Why Convert Power BI to PowerPoint
Before we explore methods for converting Power BI to PowerPoint, it’s essential to understand why professionals often move their Power BI insights into PowerPoint.
1. Presenting to Non-Technical Audiences
Executives and clients may not have access to Power BI or may prefer consuming insights in a traditional slide deck. Similarly, investors might not be familiar with new technology or concepts, so it might be better to use simple PowerPoint slides rather than complex Power BI data visuals.
2. Sharing Offline or Archived Summaries
Board meetings, printed reports, or emailed updates often require static snapshots. This is where PowerPoint slides are more convenient than data dashboards like Power BI.
3. Integrating Data into Broader Presentations
Power BI dashboards are only one part of the data story. Presenters often need to combine analytics with commentary, strategy, financials, and design elements to present the complete picture.
4. Ensuring the Message is Controlled
Power BI dashboards are interactive, but that’s not always ideal. Many presenters prefer controlling exactly what the audience sees. This is where PowerPoint is easier to control compared to Power BI.
5. Live Presentations With Real-Time Data
In other cases, executives may want fully interactive dashboards embedded directly into PowerPoint. Microsoft now enables this through the Power BI add-in. This gives the advantage of using PowerPoint to embed interactive dashboards, as well as to present other static visuals that convey more than just data.
How to Convert Power BI to PowerPoint
There are several methods for exporting your Power BI report to PowerPoint, including static images and a Live dashboard. To convert a Power BI report to PPT, follow the steps below.
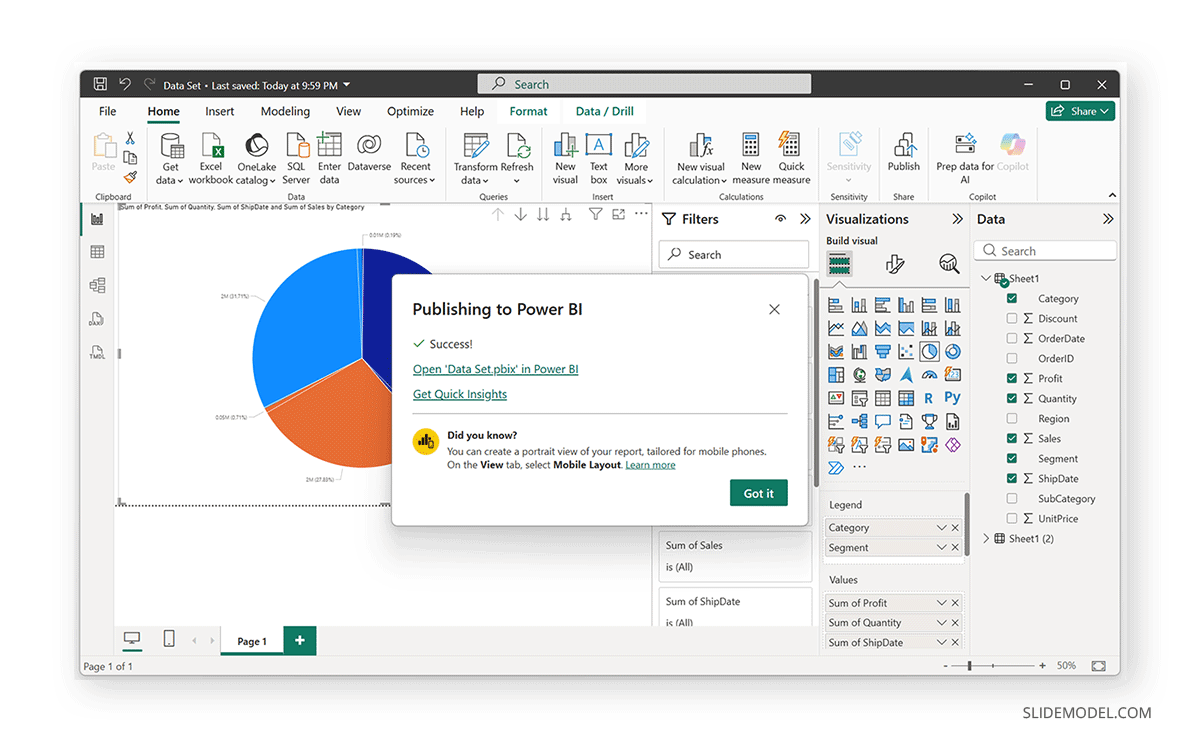
Note: For those new to Power BI, you will need to Publish your report and access it via the Power BI Service (online) before you can save it to PowerPoint. Only Premium users can access to this feature, as using the free account to publish it means anyone can access to your report, which can be a security risk.
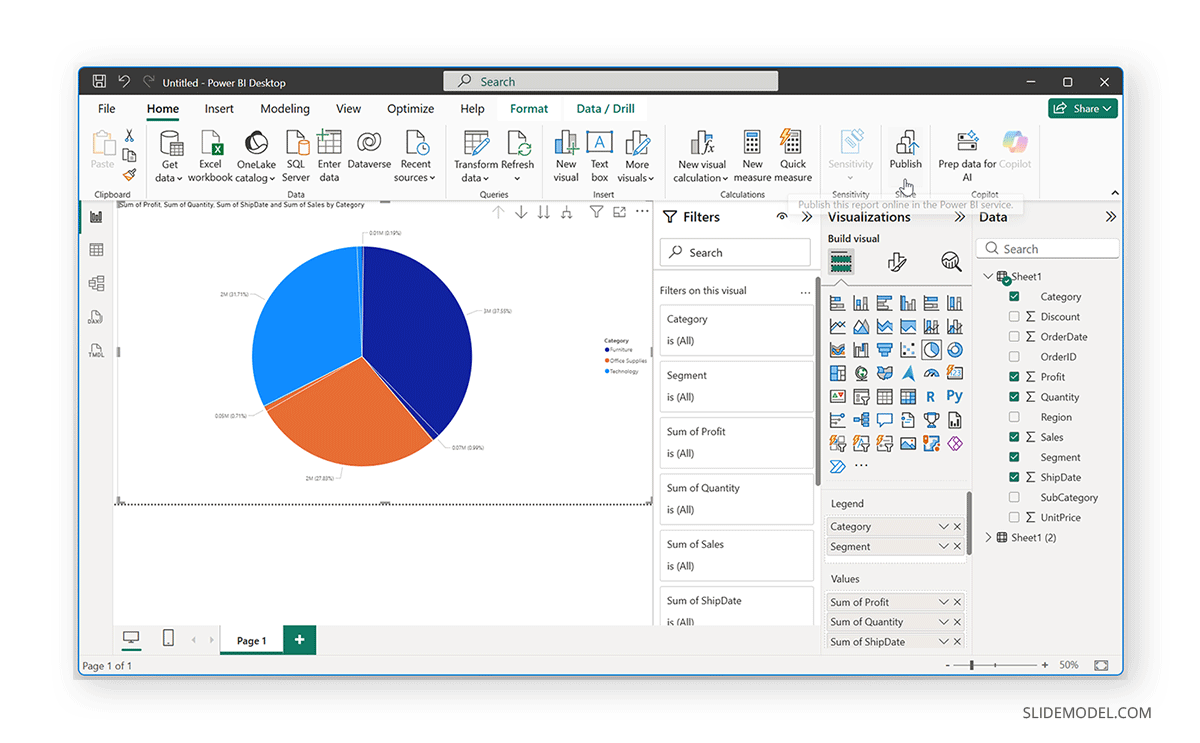
Step 1: Go to app.powerbi.com and open your report. If you have just published your report, you can also use the direct link from the dialog box that appears on screen to open the report from the Power BI service.
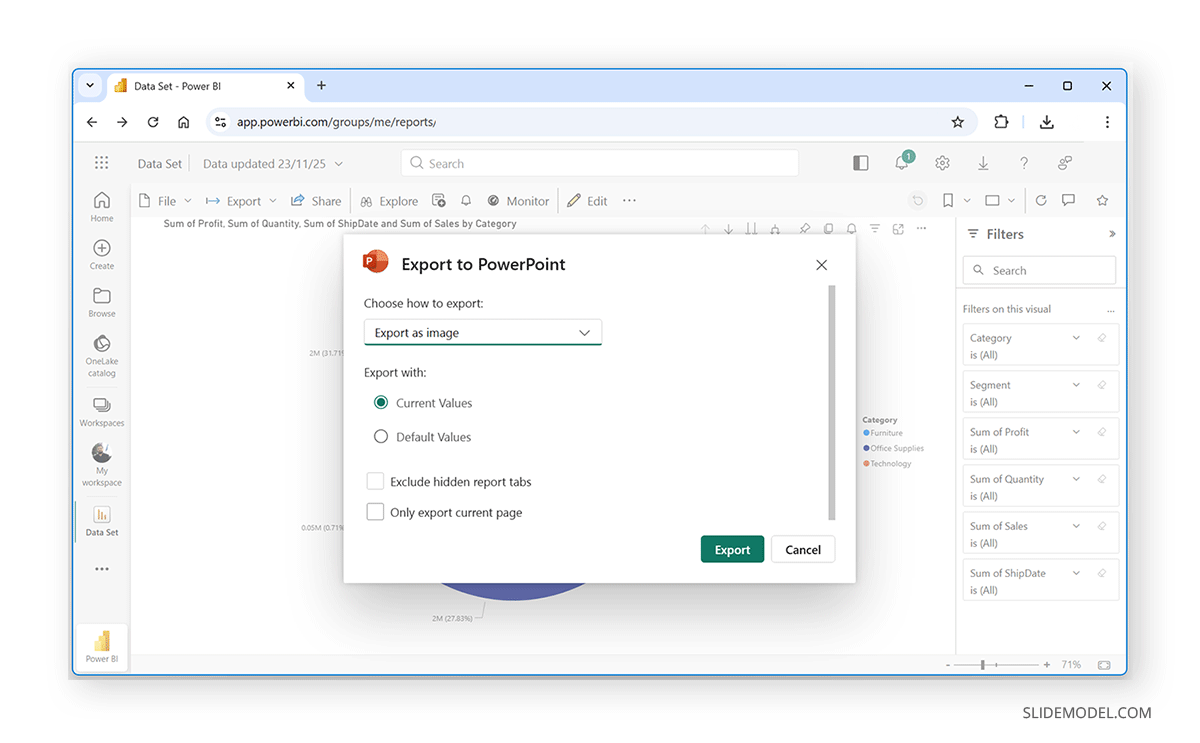
Step 2: From the top menu, select Export -> PowerPoint.
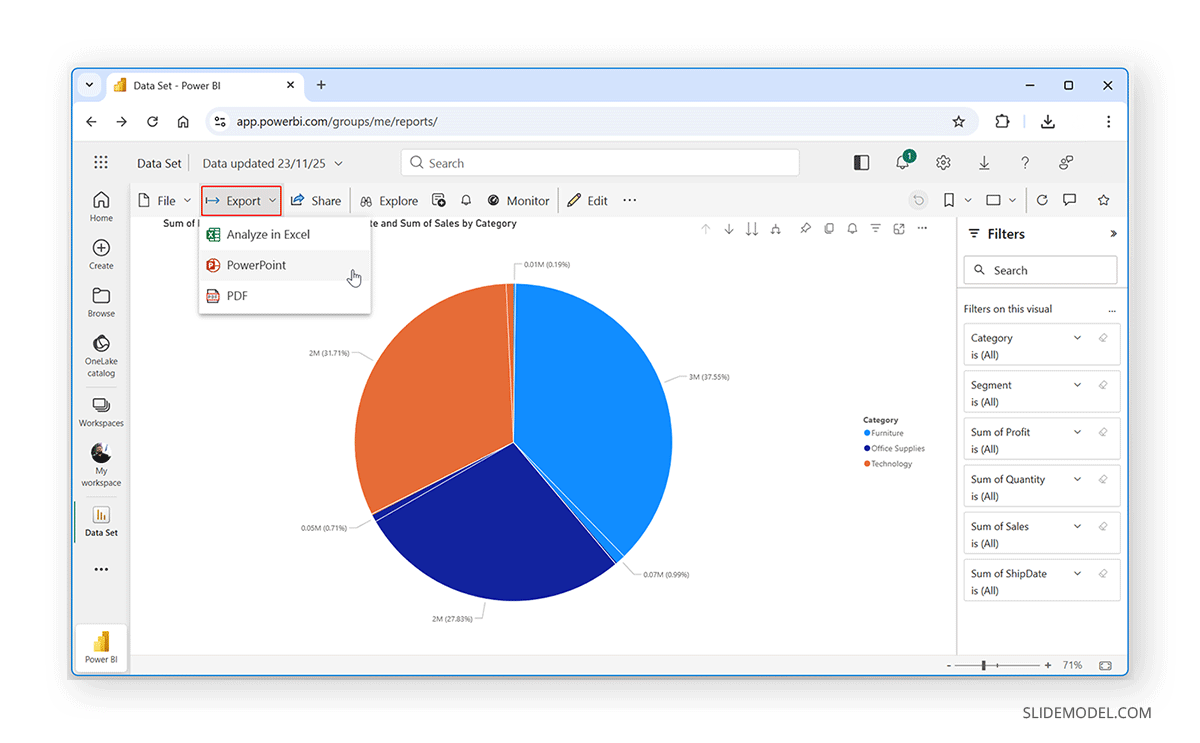
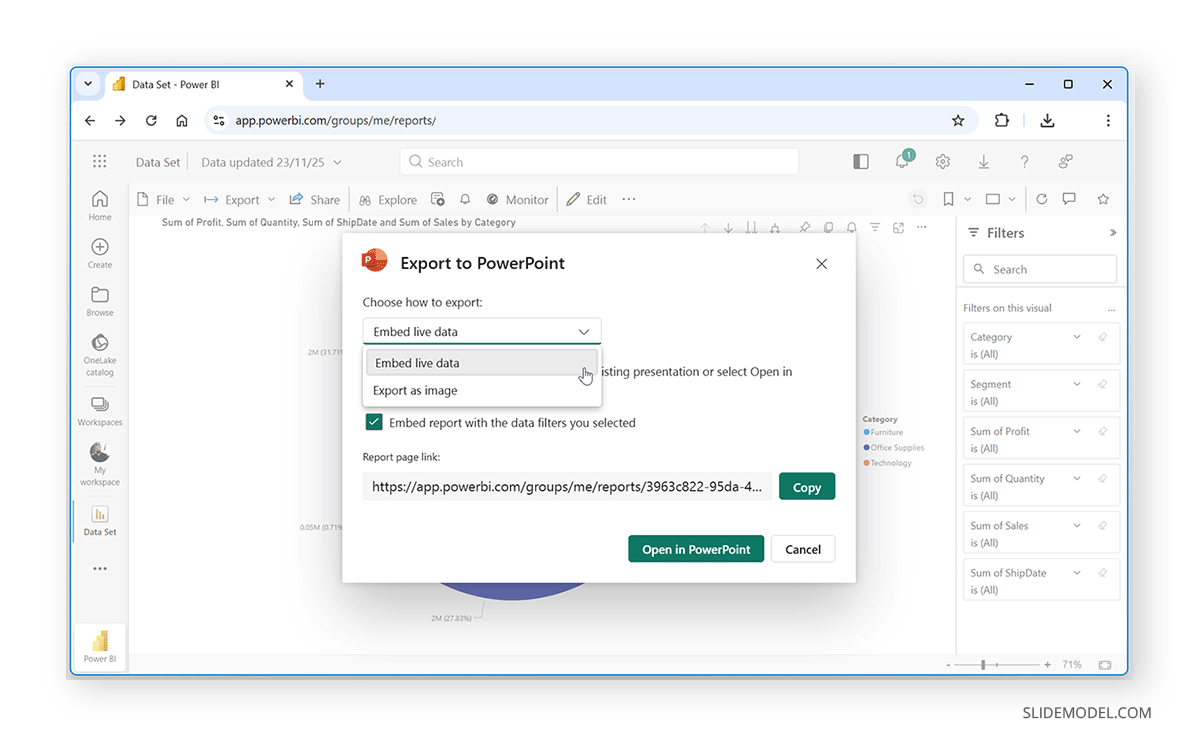
Step 3: Choose your preferred export settings. You can either export your file with embedded live data or as an image.
Export Full Reports and Individual Visuals
If you choose to export your Power BI data as an image, you can select from different options. For example, you can use current or default values, exclude hidden report tabs, and export only a single page (instead of the full report) for individual snapshots of your data.
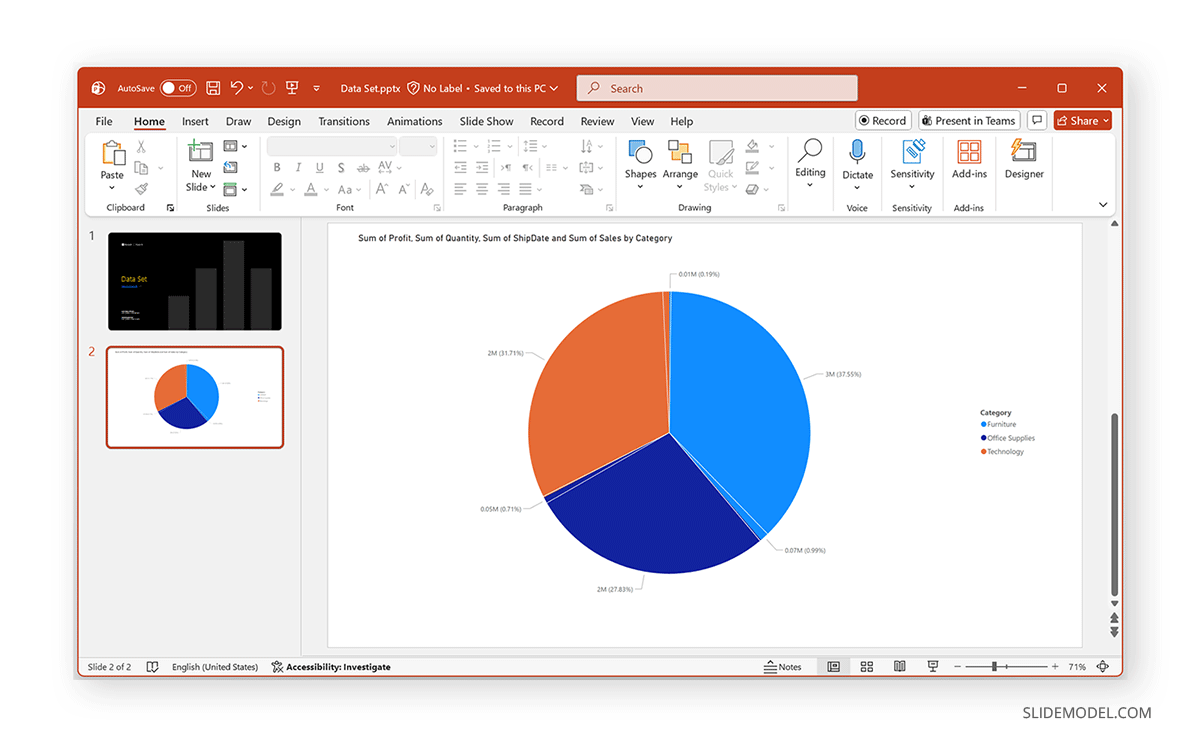
Once exported, your selected Power BI data will be downloaded as a PowerPoint file. You can also copy the static image across different PowerPoint templates to use this data as needed.
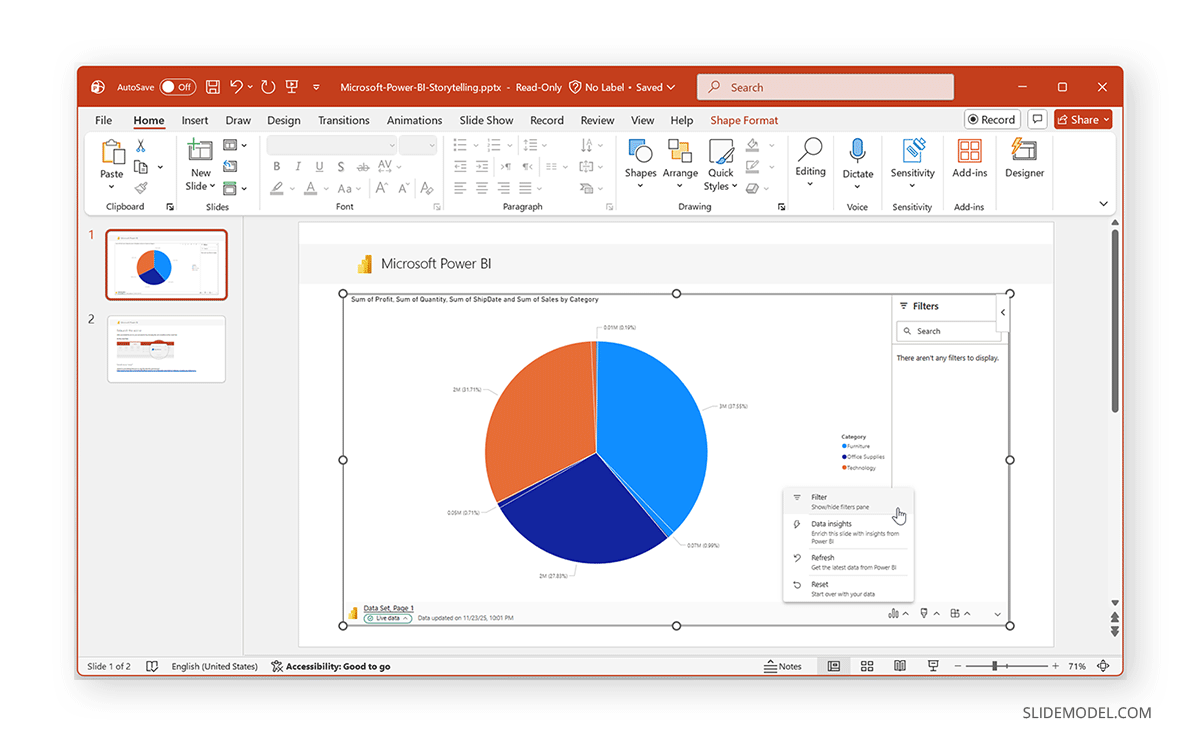
Add a Live Power BI Report Page to PowerPoint (Interactive Embedding)
This method lets you add a live Power BI report page to PowerPoint, keeping it interactive throughout your presentation. You can use the official Power BI add-in for PowerPoint to showcase your data. The add-in enables using Live filters, real-time data refresh, and secure authentication.
Using Power BI Data with PowerPoint Templates
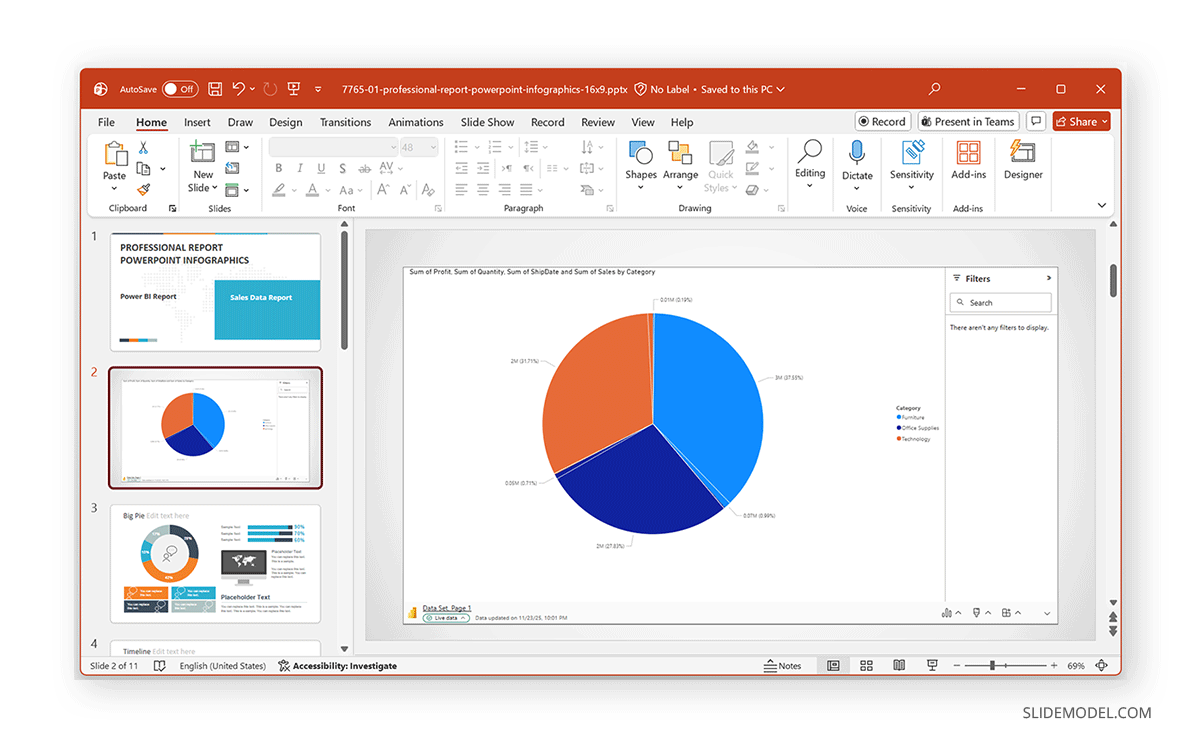
Once you have exported your data, you can use various methods to visualize it in PowerPoint using Power BI. One method to do this is to edit the downloaded file to build your presentation. Alternatively, you can copy your Power BI data from the downloaded file to another presentation. Furthermore, you can use the Power BI add-in for PowerPoint to embed Live dashboards into any presentation. In the example below, we embedded a Live Power BI dashboard into the Professional Report Infographics PowerPoint Template.
Static Export vs. Live Integration: Which Should You Use?
Now that you know how to transfer Power BI to PowerPoint, it’s time to address the two primary methods you can use your data in PowerPoint, i.e., as a static image or live embedded data.
When to use Power BI Data as a Static Image in PowerPoint
You might want to choose static exports in PowerPoint when you need an offline report, where the slides must be locked and consistent, or when you’re presenting to non-Power BI users. This type of data can also be helpful when you require printed or emailed decks.
When to Embed Live Power BI Data in PowerPoint
When using Live Power BI embedding in PowerPoint, consider the audience’s needs and your own as a presenter. This is because live data embedding can slow down your presentation and requires a stable internet connection to work correctly. You might use Live embedded data when you’re presenting real-time dashboards, need interactive filtering, your audience wants to explore data and is likely to ask questions that require drilling down into the data, or when you wish up-to-date visuals in your slides.
Troubleshooting Tips When Converting Power BI to PowerPoint
When using Power BI for exporting data to PowerPoint, especially when you’re new to it, you might come across various issues. Below is a list of some common issues and troubleshooting guidelines to help you convert Power BI to PowerPoint.
1. Unable to Export Report to PowerPoint
When you are unable to export a report to PowerPoint from Power BI, you might need to consider the following possible reasons:
- You might not have published your report and are trying to export the data from the Power BI Desktop app rather than the Power BI service.
- You might lack permission to access the dataset or report.
- The admin might have disabled export features.
- The report might have unsupported visuals.
- Browser security might block downloads.
2. Live Visuals Not Loading in PowerPoint
When Live visuals fail to load in PowerPoint from Power BI, you should:
- Check your Internet connection to see if you are connected.
- Check if you are signed in to Power BI via the PowerPoint add-in to fetch data.
- Check if your account has access to that workspace.
- Check whether the report page uses custom visuals that aren’t supported.
3. Exported Slides Look Stretched or Blurred
To fix exported slides that look stretched or blurry, try the following:
- Use actual-size exports instead of screenshots.
- Avoid resizing images too much in PowerPoint.
- Keep your browser zoom at 100% before exporting visuals.
4. Embedded Visuals Ask for Sign-in
You must be authenticated with the presenting account before slideshow mode begins.
Open the PowerPoint Power BI add-in pane and click Sign in to access your account to fetch the required data.
5. Exported File Missing Filters or Slicers
Power BI exports the report as currently filtered. You should review your slicer settings before exporting data to PowerPoint.
Design Recommendations for Presentation-Friendly Power BI Visuals
Power BI dashboards are designed for interactive exploration, but not all of those elements translate well to PowerPoint slides. To make your visuals more presentation-friendly, apply the following enhancements.
1. Simplify Clutter
Slides need to be visually clean and easy to interpret at a glance. Remove elements that don’t contribute to the story, such as gridlines, redundant legend entries, excessive axis ticks, or labels that simply repeat the chart title. A cleaner, more spacious layout draws attention to your main insight rather than overwhelming your audience with detail.
2. Use Larger Fonts for Presentations
Font sizes that work inside Power BI often appear too small once exported to PowerPoint or projected on a large screen. Increase the size of your titles, axis labels, and data labels so they remain readable from the back of a meeting room. Bigger fonts make the information more accessible and help your visuals appear more polished.
3. Choose the Right Visual for the Story
Different insights require different visual formats. Use cards to present key KPIs, bar charts to highlight comparisons, and line charts to show trends over time. Tables should be reserved for slides where detailed information is essential. The right visual type helps your message land quickly and accurately.
Executives often view slides at a distance, so visuals need strong, clear color contrast. Choose clean, high-contrast palettes that distinguish categories clearly without overwhelming the viewer. This ensures your charts remain legible and visually compelling in all presentation environments.
4. Keep One Insight Per Slide
Power BI dashboards can contain multiple elements, but slides should not. Crowded slides confuse viewers and dilute the takeaway. Break complex dashboards into various, focused slides, each dedicated to a single insight or question. This improves comprehension and strengthens your narrative flow.
5. Add Your Commentary
Power BI delivers the numbers, but PowerPoint provides the story. Use notes, callouts, annotations, or summaries to explain the visual’s significance. Your commentary guides viewers toward the key insight and ensures the slide communicates meaning, not just data.
Final Words
Power BI and PowerPoint together create a powerful workflow for clearly and professionally communicating insights. You can choose from several reliable methods to convert Power BI to PowerPoint to export full reports, static images, and embed live Power BI pages into PowerPoint.
By using Power BI data with PowerPoint templates, such as by embedding Live dashboards or using static visuals from reports, you can mix your data with professionally crafted design elements to explain the ‘data story’, instead of relying on your audience to interpret figures into insights.