Business
Find and read about a wide variety of business-related content and presentations.
Policy Rollout Presentation: How to Communicate New Policies Without Losing Your Audience
Most new policies fail in the room, not on paper. Learn to structure a rollout presentation that employees understand and follow.
Capacity Planning Presentation: A Guide to Structure, Data & Stakeholder Buy-In
Capacity planning presentations turn complex resource data into decisions leadership can actually act on. Learn how to create one here!
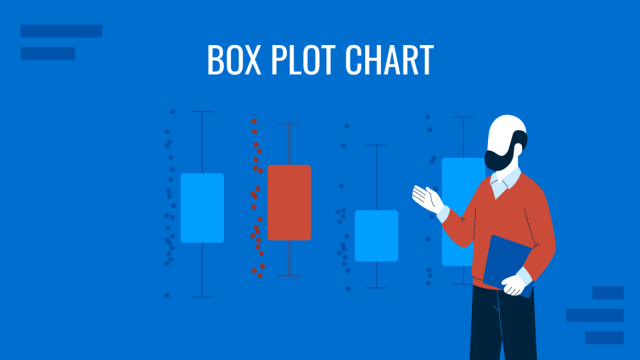
Box Plot Chart for Presentations
Most presenters default to bar charts, but box plots tell a richer story. Find out what they show, when to use, and how to make them work for any audience.

How to Use Gap Analysis to Improve Business Performance
Learn how to run a gap analysis, from types and frameworks to a worked example and how to present findings to leaders.

Succession Planning Presentation
A strong succession planning presentation signals organizational maturity. Discover how to create one with the right template to deliver it.
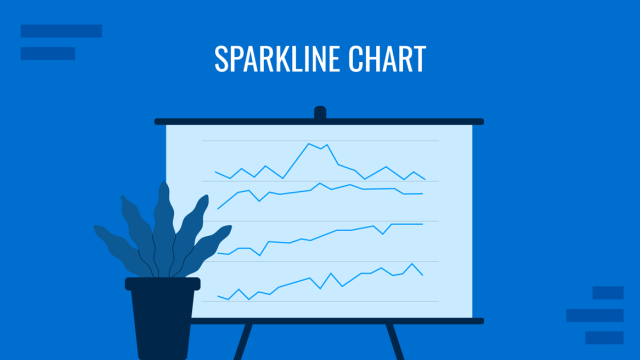
Sparkline Chart for Presentations
Small but powerful, sparkline charts let you show trends without overwhelming your slides. This guide covers how to use them effectively in any presentation.
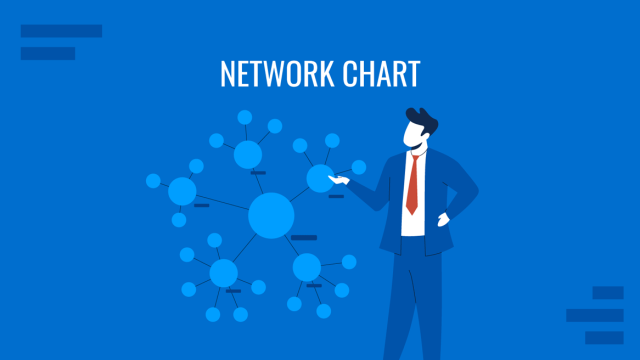
Network Chart in Presentations
Visualizing relationships and systems are where network charts shine; discover how to bring them into your deck.
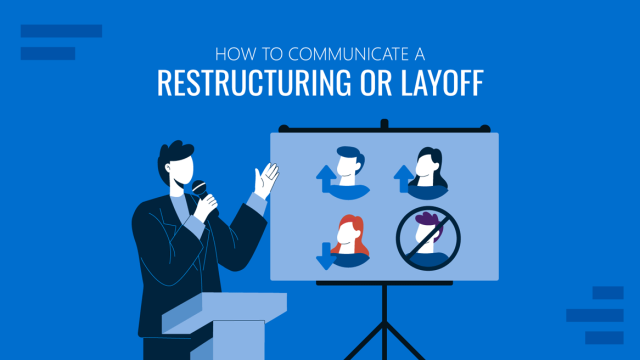
Layoff Presentation: How to Communicate a Company Restructuring
Build a restructuring or layoff presentation that explains the decision, sets clear next steps, and keeps employees informed.
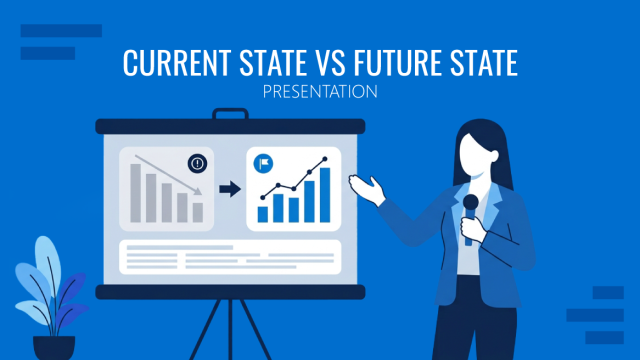
Current State vs Future State Presentation
A current state vs future state presentation only works when both columns hold up under scrutiny: current state grounded in data, future state tied to a named mechanism and date.
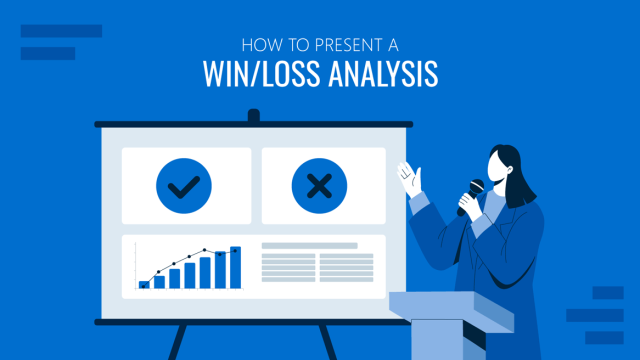
How to Present a Win and Loss Analysis
A practical guide to structuring, designing, and presenting a win/loss analysis so sales, product, and leadership act on it.
EBITDA Slide in Presentations
A practical guide to designing EBITDA slides, from choosing chart types to structuring the bridge for board and investor decks.
Churn and Retention Analysis Presentation
From defining your metrics to framing your findings, learn how to deliver a churn and retention analysis presentation that drives action and clarity.