
Presenting leadership concepts to an audience requires a structure that not only explains theory but also operationalizes it. The Blake and Mouton Managerial Grid remains one of the most widely used models for describing managerial behavior because of its simplicity, clarity, and direct link to daily work dynamics. When included in a presentation, the model can illustrate leadership styles, highlight opportunities for improvement, and support decisions related to team development or organizational change.
This article examines how to present the Managerial Grid in a business environment, focusing on clarity, narrative flow, and audience comprehension. We aim to give presenters depth to transform a theoretical framework into a practical lens that guides reflection and discussion in their organizations.
What is the Blake and Mouton Managerial Grid?
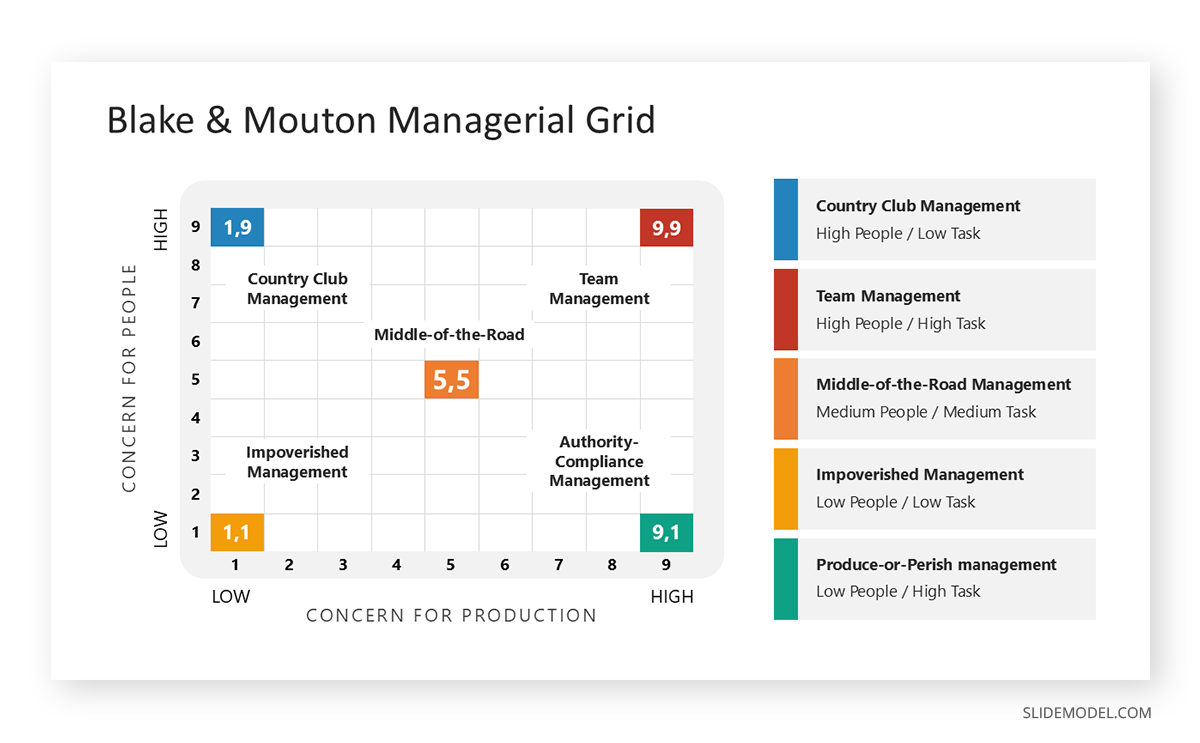
The Blake and Mouton Managerial Grid is a leadership model that maps managerial behavior along two independent dimensions: concern for people and concern for production. Developed in the 1960s by Robert R. Blake and Jane S. Mouton, the framework uses a nine-point scale on each axis to indicate the degree to which a manager prioritizes team relationships versus task accomplishment. By plotting these two concerns on a grid, the model identifies five primary managerial styles: Impoverished (low people, low production), Country Club (high people, low production), Authority-Compliance (high production, low people), Middle-of-the-Road (moderate on both), and Team Management (high on both).
The grid does not measure personality or competence; instead, it highlights behavioral tendencies and leadership orientation. Organizations use it to facilitate discussions on management effectiveness, team dynamics, and leadership development, emphasizing that managerial approaches can vary with context and organizational demands.
To classify areas, the Managerial Grid uses a numerical scale from 1 to 9 on each axis to represent the degree of emphasis a manager places on two dimensions: concern for people and concern for production. A score of 1 indicates minimal focus, while a score of 9 reflects strong priority. These scores do not measure performance or effectiveness; they indicate behavioral orientation and managerial preference. By combining the two numbers, one from each axis, a specific position is plotted on the grid. The interaction between these coordinates forms the basis for identifying distinct leadership tendencies within the model.
The Five Managerial Styles Explained
Introducing the five leadership styles is central to a Managerial Grid presentation. Each style requires a deliberate explanation because audiences must understand the behavior patterns, decision-making tendencies, and operational outcomes associated with each quadrant or midpoint. A presentation benefits from dedicating one slide per style, allowing the audience to absorb details without distraction.
Impoverished Management (1,1)
This style reflects minimal concern for people and minimal concern for production. Managers who fall into this quadrant may avoid involvement in both interpersonal and operational issues. The presentation should explain that this does not always indicate intentional neglect; it can stem from a lack of authority, disengagement, burnout, or unclear expectations.
Visuals can indicate low engagement, delayed decisions, and a lack of direction. The presenter must clarify that teams under this style often operate without guidance, leading to inefficiencies and low morale.
Country Club Management (1,9)
This quadrant shows high concern for people but low concern for production. Leaders who use this style prioritize harmony, comfort, and avoiding conflict. Presentations often resonate with audiences here because many organizations recognize this pattern in managers who are well-liked but struggle to enforce performance standards.
The slide should explain how this style maintains positive relationships while also risking compromising results. Presenters can highlight how this behavior emerges in environments where internal cohesion is valued excessively over output.
Authority-Compliance Management (9,1)
This style represents strong concern for production and minimal concern for people. It is commonly associated with directive leadership, strict control mechanisms, and highly structured environments. In presentations, this quadrant should be explained with an emphasis on process efficiency, discipline, and clarity. Yet the presenter must also point out that an overemphasis on control can create resistance within teams, diminish creativity, and increase turnover. This discussion helps the audience understand the trade-offs embedded in highly task-oriented leadership.
Middle-of-the-Road Management (5,5)
This midpoint reflects moderate concern for people and moderate concern for production. It suggests balance but also compromise. Managers in this position try to maintain acceptable levels of both interpersonal cohesion and results, but may hesitate to commit fully to either dimension.
Presenters should explain that this style often arises when leaders seek to minimize friction, leading to predictable but unremarkable performance. Slide visuals here should clarify that this is not intended as mediocrity, but rather a tendency toward risk avoidance.
Team Management (9,9)
Considered the most effective style by Blake and Mouton, this quadrant balances high concern for people and high concern for production. It emphasizes shared goals, collaboration, accountability, and a sense of purpose that aligns individual engagement with organizational results.
Presentations should explain why this style is considered ideal but not necessarily universal; achieving it requires specific conditions such as mature team dynamics, supportive organizational culture, and structural clarity. This section should help the audience see how the model elevates team management as a direction rather than a simplistic prescription.
Introducing the Blake and Mouton Managerial Grid to an Audience
The introduction slide should begin with a simple question or observation about leadership variability, then transition into the premise that leadership behavior can be mapped. Establishing need precedes introducing the diagram. Audiences engage more when they understand the rationale behind the framework before seeing it.
When revealing the grid visually, the presenter should avoid displaying all five managerial styles at once. A sequential unveiling, first the axes, then the five specific locations, reduces cognitive overload. Many presentations fail because they reveal too much simultaneously. A progressive reveal invites the audience to follow the presenter’s reasoning.
The tone should remain instructional rather than promotional. The goal is to avoid portraying the Managerial Grid as an absolute truth. Instead, the model should be introduced as a structured way of interpreting behavior. Connecting the grid to audience experiences is essential. For example, the presenter may reference common workplace dilemmas, such as overly hands-off leaders or excessively relational managers, and then show where those tendencies fall on the grid.
Clarifying misconceptions is part of this introduction. The most common assumption is that the model permanently categorizes leaders. Presenters must explain that the grid describes tendencies rather than fixed identities. Leadership behaviors respond to context, experience, and organizational demands. The grid simply illuminates patterns in leadership presentations.
The audience should leave this section ready to explore the five styles in greater depth, which prepares them for subsequent sections of the presentation.
Designing a Presentation Around the Five Leadership Styles
Now that we established what the managerial grid can offer in terms of comprehension, it’s time to consider how we can craft an appropriate presentation structure to guide the audience into the five leadership styles.
As mentioned before, the presentation should begin with a general introduction to the grid, followed by a focused segment on each of the five managerial styles. Each subsection requires examples, characteristics, and potential implications.
The best slide layout follows this sequence:
- Define the style concisely.
- Describe common behaviors associated with that style.
- Provide an operational example.
- Explain potential strengths and limitations.
This format ensures consistency across all five styles. Presenters should maintain the same visual layout for each style slide to support pattern recognition. The goal is to guide the audience through the styles without introducing unnecessary design complexity.
Transitions also matter. After each style, a brief comparative slide can help audiences situate the style relative to the others. For example, a slide showing the positions of the Country Club and Authority-Compliance styles on opposite sides of the grid clarifies how different their orientations are.
FAQs
What is the main purpose of presenting the Blake and Mouton Managerial Grid?
The primary purpose is to provide a clear framework for discussing managerial behavior in terms of task orientation and people orientation. Presentations use the grid to create a shared reference point for understanding how leadership approaches influence team performance and decision-making. It helps audiences interpret tendencies rather than assign fixed labels.
Should the Managerial Grid be presented solely as a diagnostic tool?
No. It should be positioned as an interpretive model that guides reflection. While it highlights patterns, it does not replace formal assessments or performance evaluations. The presenter must clarify that movement across styles is expected and that the grid reflects tendencies shaped by context.
How many slides should be dedicated to explaining the five managerial styles?
A minimum of one slide per style is recommended to avoid compressing information. Each style benefits from a consistent layout: definition, typical behaviors, example, and implications. A comparative summary slide at the end reinforces distinctions.
Can the Blake and Mouton grid be used with large audiences unfamiliar with leadership theory?
Yes. Its simplicity makes it accessible, provided the presenter builds the narrative gradually: axes first, then the plotted quadrants, and finally the five styles. Visual pacing is essential to avoid overwhelming the audience.
How do I explain the numerical scoring on the axes?
Keep it simple. Scores indicate degree, not precision. A “9” reflects strong emphasis, while a “1” signals minimal focus. The numbers help position tendencies visually, but should not be interpreted as measurable psychological metrics.
Should the Blake and Mouton grid be introduced before or after discussing organizational challenges?
Introduce challenges first. Establishing context prepares the audience to understand why the model matters. Showing the grid afterward makes it feel like a direct response to the issues raised.
Final Words
The Blake and Mouton Managerial Grid offers a structured way to interpret managerial behavior through two clear dimensions: concern for people and concern for production. Its value in presentations lies in its visual simplicity and practical relevance. By mapping leadership tendencies onto a grid, audiences gain a shared language for discussing how managers balance task execution with relational dynamics. The framework does not categorize leaders permanently nor prescribe a rigid ideal; instead, it provides a reference point for reflection, comparison, and development.
When presented with clarity and context, the grid becomes more than a diagram. It supports constructive dialogue about performance expectations, team cohesion, and organizational culture. Its strength lies in helping participants recognize patterns, question assumptions, and consider how leadership approaches can evolve. Used thoughtfully, the model encourages deliberate leadership rather than reactive management.