Flat Horizontal Bar Gantt Chart Template
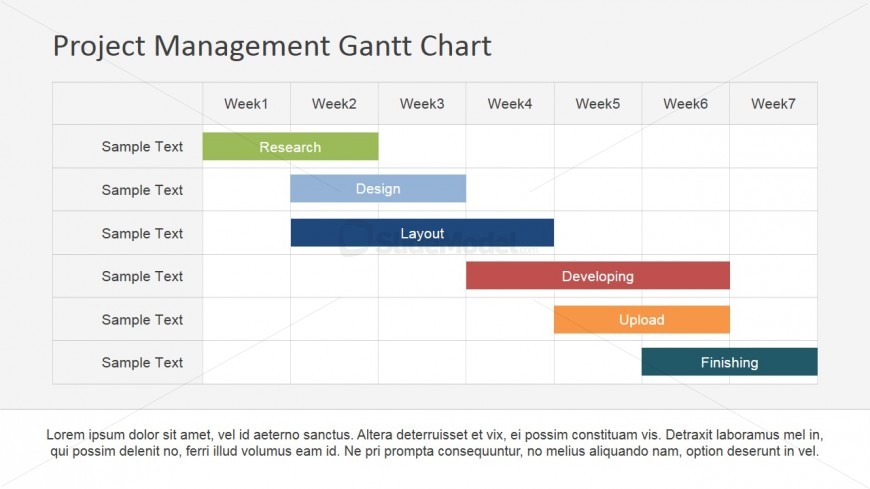
The Gantt chart template shows how different tasks related to a weekly basis can be shown displayed in a grid. The task names can be included in the flat bar itself and a small text can be entered corresponding to the each bar. The tasks are plotted against time which is measured in terms of weeks. This template is ideal for research and development work in which there are a few separate tasks related to each other. You can include important details regarding the project in the text area made available at the end of the slide. This graphical approach is easy for the readers to follow.
Return to Project Management Gantt Chart PowerPoint Template.
Download unlimited PowerPoint templates, charts and graphics for your presentations with our annual plan.
DOWNLOADReturn to Project Management Gantt Chart PowerPoint Template.
