Group Pillar PowerPoint Design
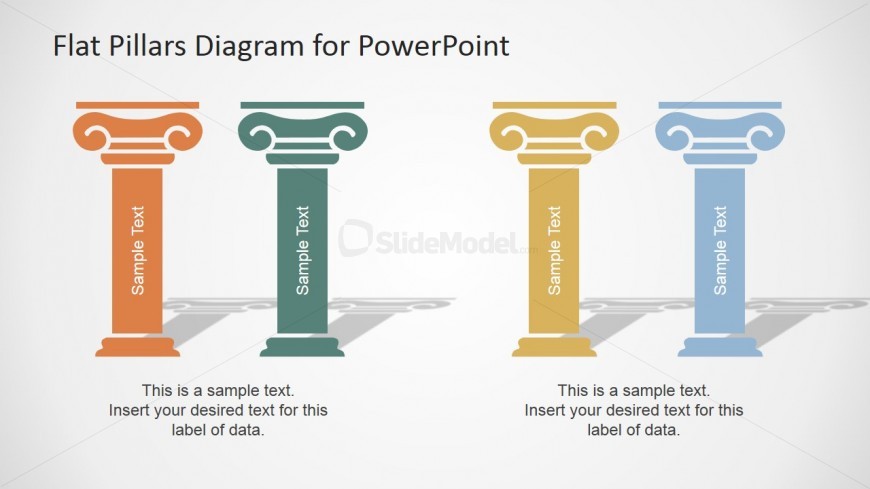
In this PowerPoint slide is a Group Pillar Diagram for PowerPoint. It is useful for comparing pillars, or classes, in groups. For example, two pillars may be related to each other and therefore are place in one group. It is then compared to the remaining pillars that are placed in another group. It is ideal for discussing market diversification with close market relationships.
Four vector drawings of pillars are shown in pairs on the slide. They are colored orange, green, yellow, and blue. Each pillar and each pair has a text placeholder for labels and descriptions. The PowerPoint vectors, their size and arrangement, can be edited without affecting their image resolution.
Return to Flat Pillars Diagram for PowerPoint.
Download unlimited PowerPoint templates, charts and graphics for your presentations with our annual plan.
DOWNLOADReturn to Flat Pillars Diagram for PowerPoint.


