Flat Colorful Gauge Illustration
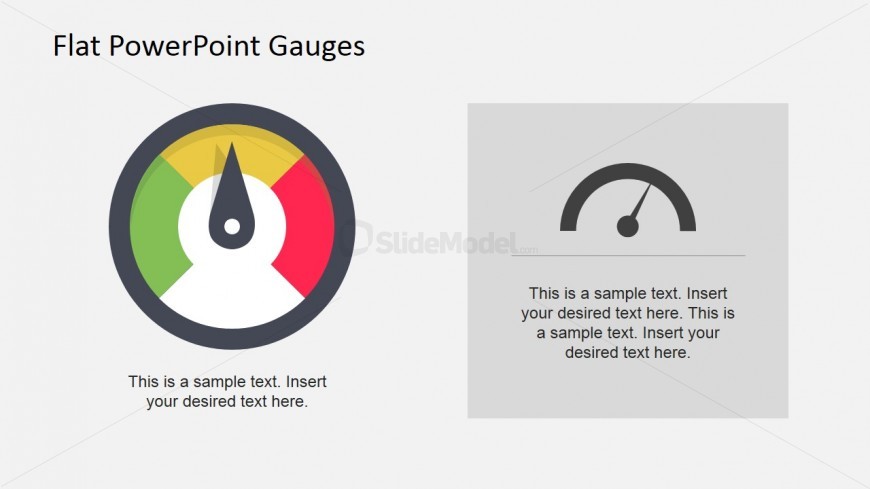
The presenter can make use of the Flat Colorful Gauges for PowerPoint to show an overview of three gauges. These can represent different departments or jobs, showing their corresponding levels of difficulty or priority through the colored segments of the gauges.
The PowerPoint design features three vector drawings of fuel gauges. Their pointers show different segments of the gauge, colored green, yellow, and red. Text boxes are provided below each gauge for additional descriptions. The PowerPoint objects are 100% customizable. They can be edited to fit the presenter’s preferences.
Return to Flat Dashboard Gauges for PowerPoint.
Download unlimited PowerPoint templates, charts and graphics for your presentations with our annual plan.
DOWNLOADReturn to Flat Dashboard Gauges for PowerPoint.
