Exclusive Market Research PowerPoint Template
The user can create artistic charts and diagrams using the exclusive Market Research PowerPoint Template. Produce top-quality slides applicable to any business situation. The charts and graphs may include all types of information, from household data to corporate statistics.
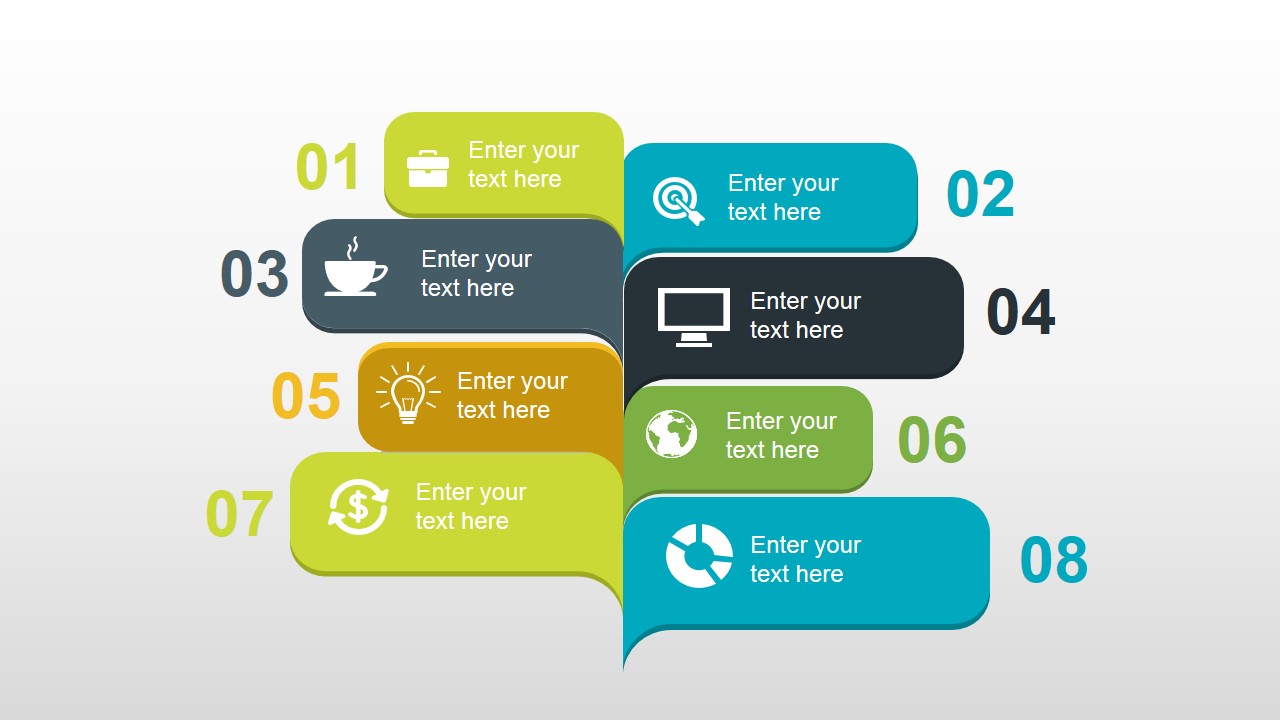
The PowerPoint template is ideal for use in market research presentations. The graphic can represent different key performance indicators. This is useful in board meetings to show market growth over time. The data found in the slides may be used by management to compose an 8-step plan for success. The presenter may download other successful PowerPoint templates from the Gallery to complement the presentation. An example is the Business Review PowerPoint Template.
A blue-green color theme is used in the Office template, and is 100% editable. This lends the presentation an effective visual aesthetic to appeal to the audience. The color combination also gives the slides a clean, professional look and feel.
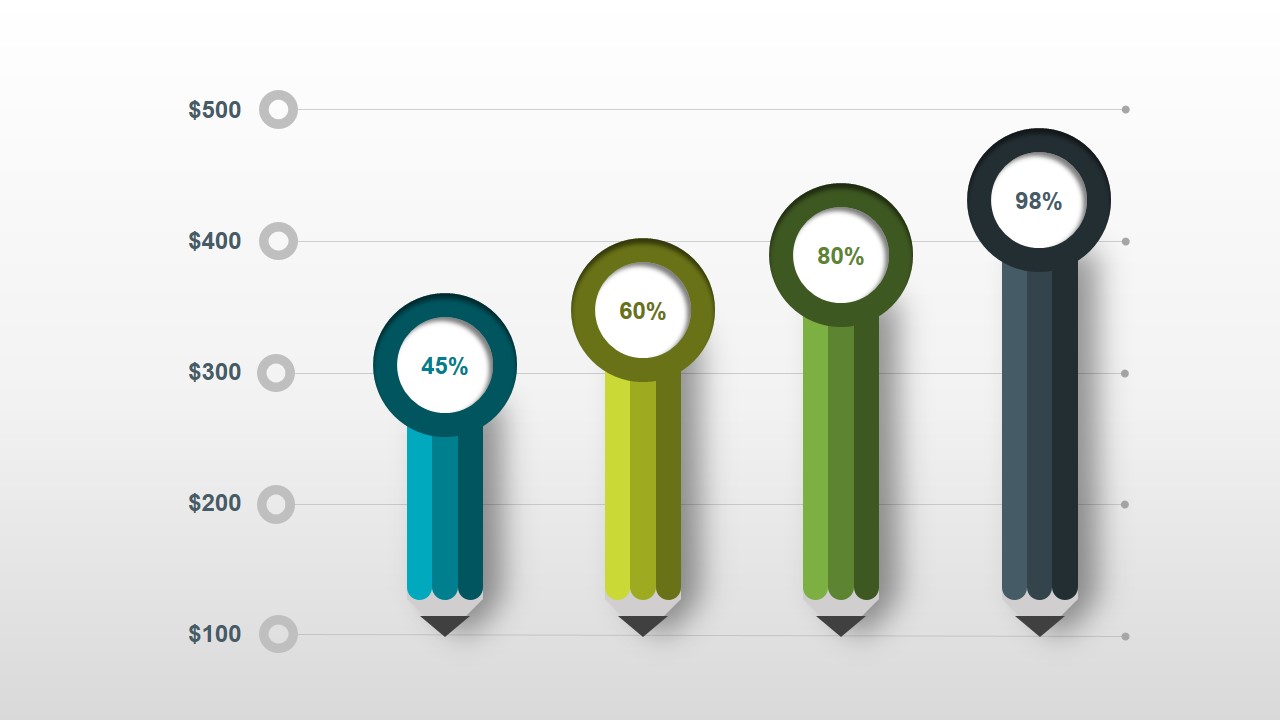
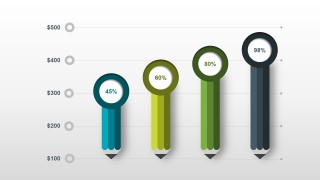
The first of the PowerPoint slides contains a creative bar chart. The conventional rectangular bars have been replaced by pencil Shapes of different colors. The pencils have circular points which contain percentages. The slide may be used to feature a marketing plan forecast over a period.
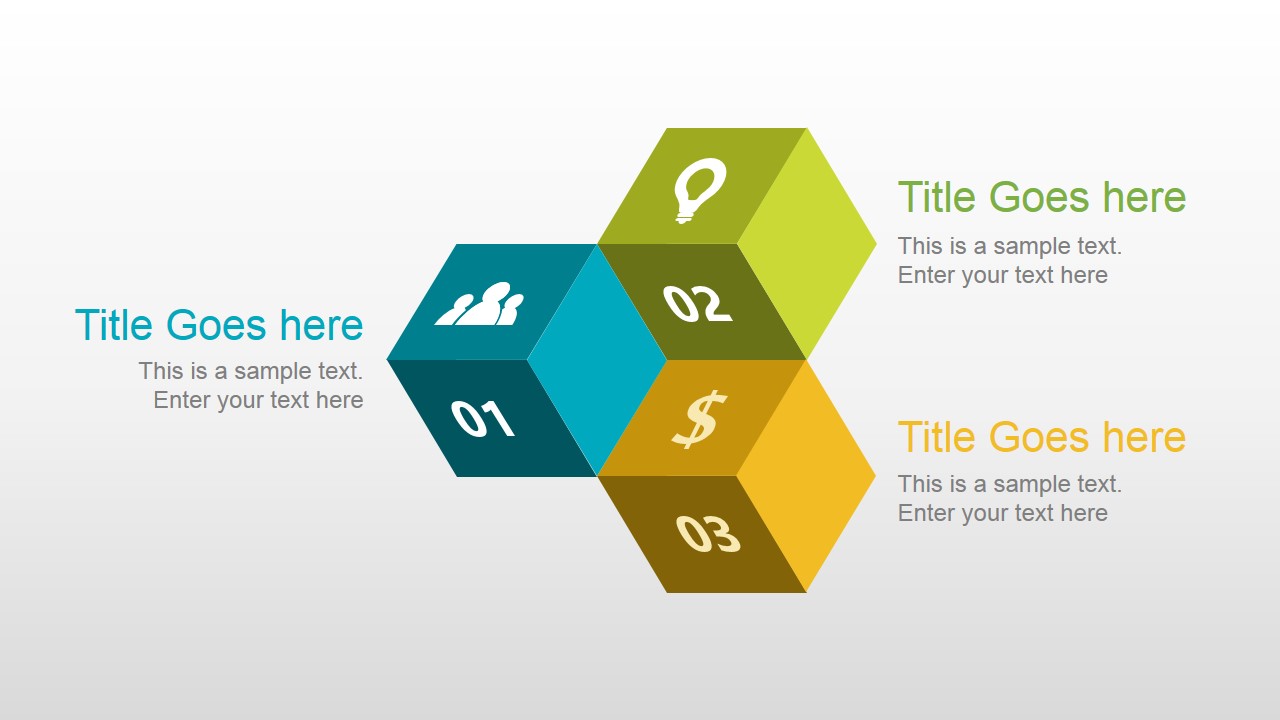
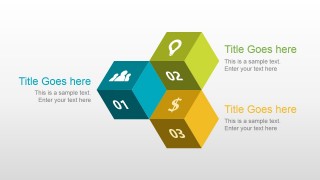
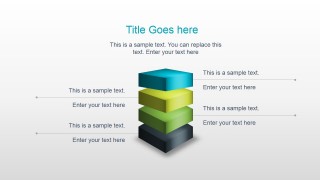
Also included in the template are three connected cubes. These cubes contain numbered labels and icons. They may be used to represent three main segments in a marketing presentation. The user may place additional data in the text placeholders around the cube diagram.
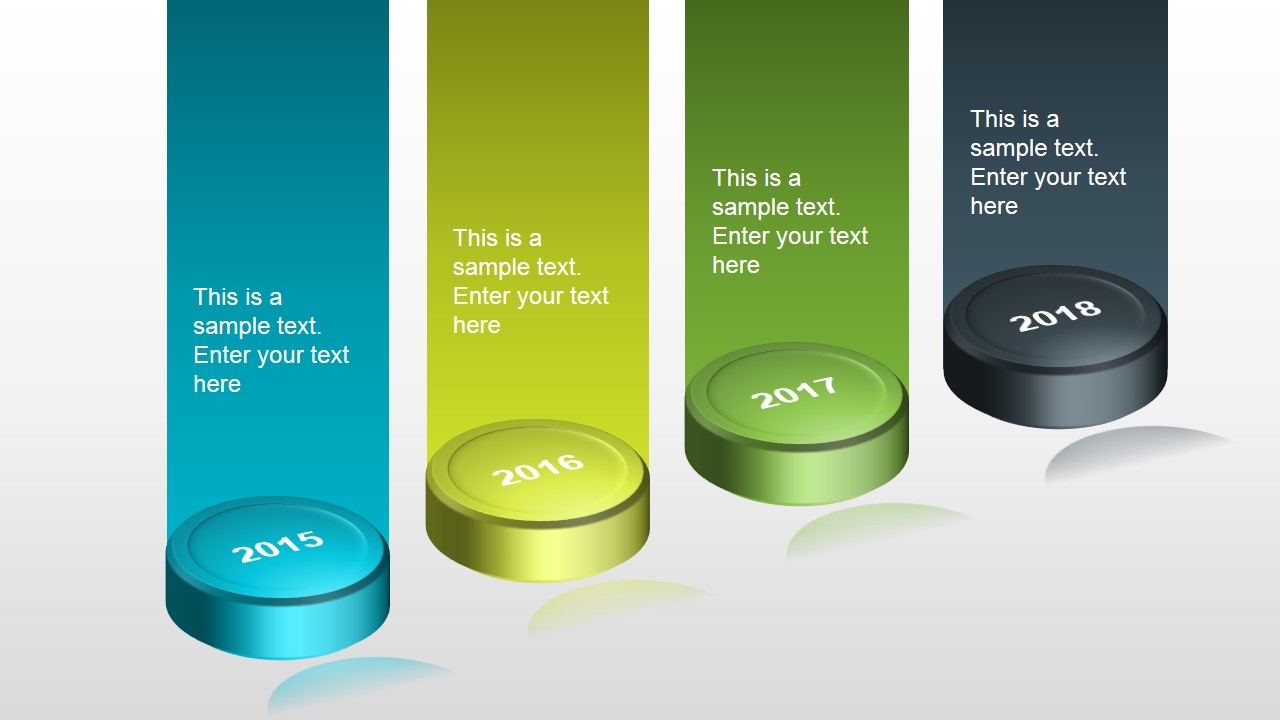
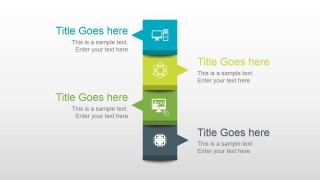
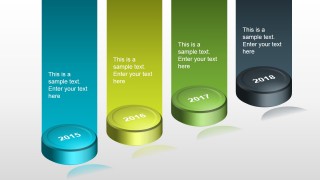
A slide containing four callout boxes is also included in the template. It may be used to show product differentiation characteristics. The callouts include white minimalist logos so that can be easily identified. A fourth slide contains a creative alternative to the traditional timeline. It features four cylinders with years as labels. The 3D PowerPoint shapes are arranged in a diagonal to give the illusion of distance.
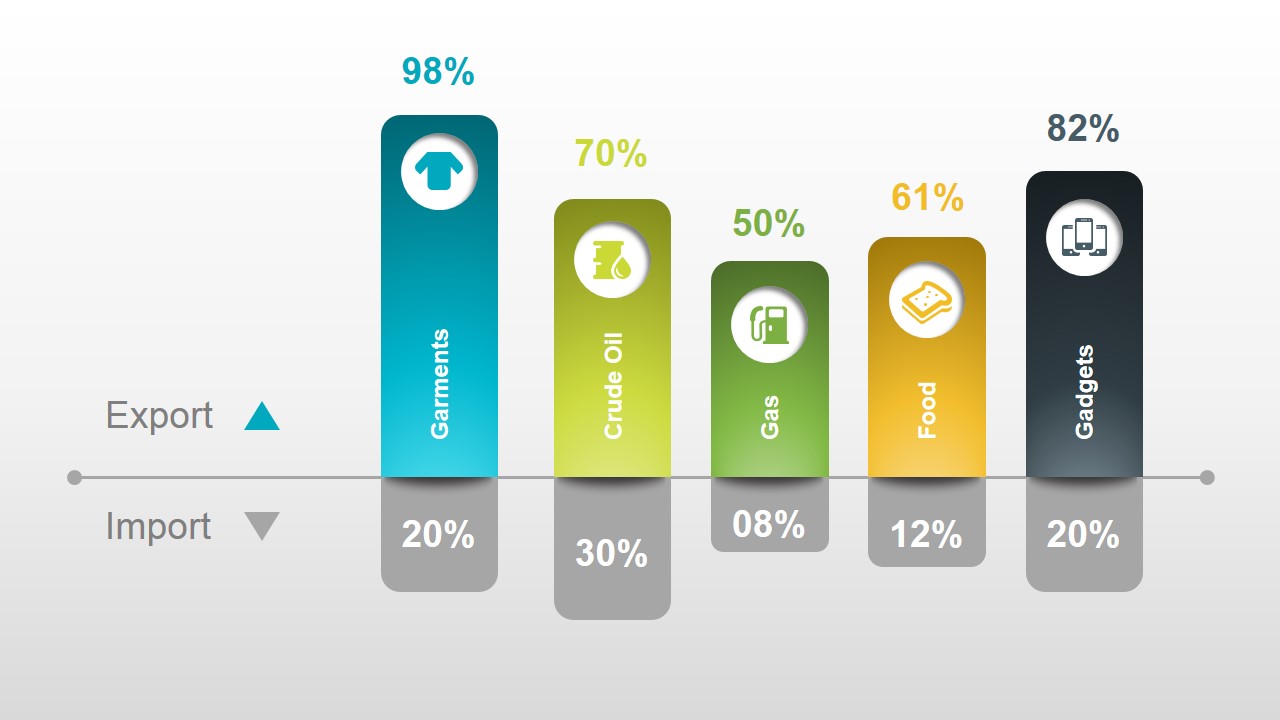
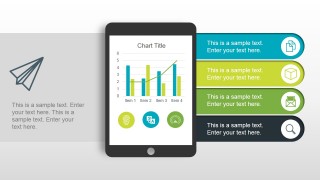
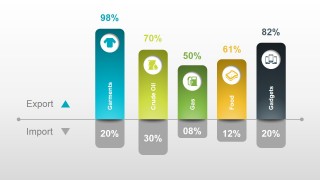
The PowerPoint template also has a marketing dashboard slide. This features an overview of data for KPI’s balance of trade. The main feature of the slide is a PowerPoint Shape of a tablet. This is accompanied by four banners where data and icons are found. The user may use another of the PowerPoint slides to compare imports vs exports. This may be done with the use of a colorful bar chart presentation. The remaining slides may be utilized for final evaluation.
The PowerPoint template is most suitable for presenting key performance indicators. This allows corporate management to make more well-informed decisions. The user may edit any of the PowerPoint objects to fit his requirements.
