Creative 3D Perspective Pie Chart for PowerPoint
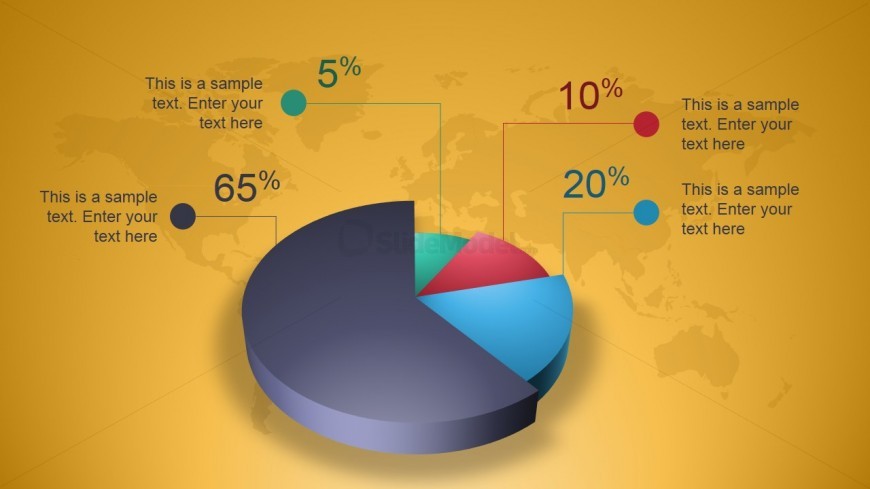
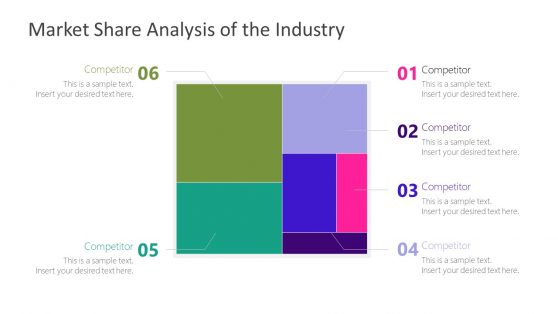
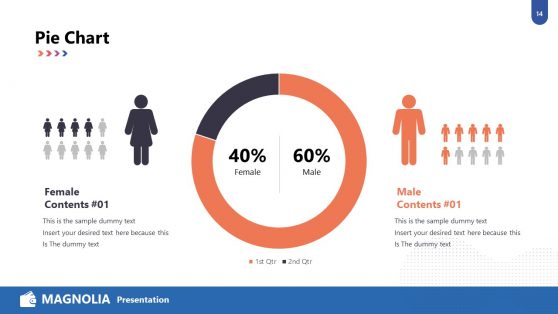
This slide design features a creative 3D perspective pie chart for PowerPoint, which may be used as a visually-appealing presentation of percentages of business statistics such as market shares and company expenses.
The PowerPoint pie chart graphic is divided into four segments, colored gray, blue, red, and green, which are placed so that they resemble a winding staircase. Labels and descriptions may be inserted in the text placeholders which are connected to the segments by thin lines in corresponding colors. Percentages appropriate for each segment may be inserted in the text placeholders found on top of each line. The presentation background is a watermark of the world map, implying that this PowerPoint template is most suitable for the presentation of global statistics. The PowerPoint objects are 100% editable to suit the presenter’s needs and preferences.
Download unlimited PowerPoint templates, charts and graphics for your presentations with our annual plan.
DOWNLOAD