Editable Core Content Presentation Slide with Bar Graph
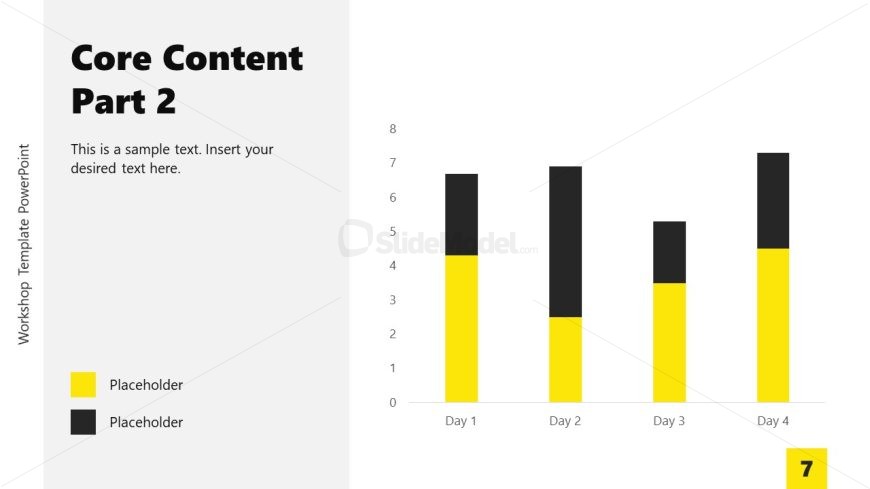
The image features a PowerPoint slide titled “Core Content Part 2,” part of a workshop presentation template. The slide’s design is split into a text section on the left and a chart on the right. The text section has a gray background and contains the slide’s title in large black font at the top, followed by a placeholder text area for additional details or descriptions.
On the right side of the slide, there’s a bar chart with four sets of vertical bars representing four consecutive days, labeled “Day 1” through “Day 4.” Each bar is divided into two segments: the lower segment in yellow and the upper segment in black, likely representing different values or components of data being measured across the days. There are legends marked as “Placeholder” with corresponding color boxes in yellow and black below the chart, indicating where the presenter can define what each color in the bars represents.
The overall design is clean and modern, with a simple color scheme that allows for easy interpretation of the data. The slide is numbered ‘7’, indicating its sequential position within the presentation.
This template slide is ideal for business or educational presentations that require the display of data trends over time. It could be used in a variety of contexts, from sales and marketing analysis to academic research presentations, where visual representation of data is crucial for understanding and discussion.
Return to Workshop Template PowerPoint.