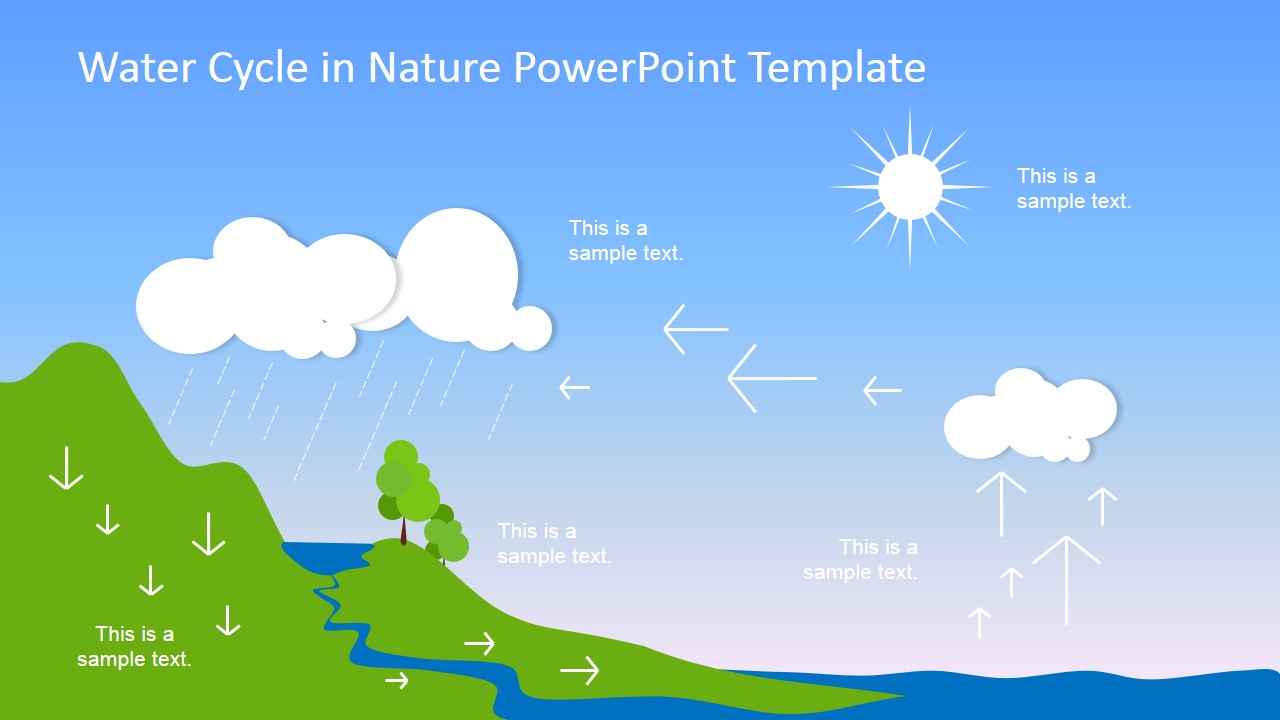
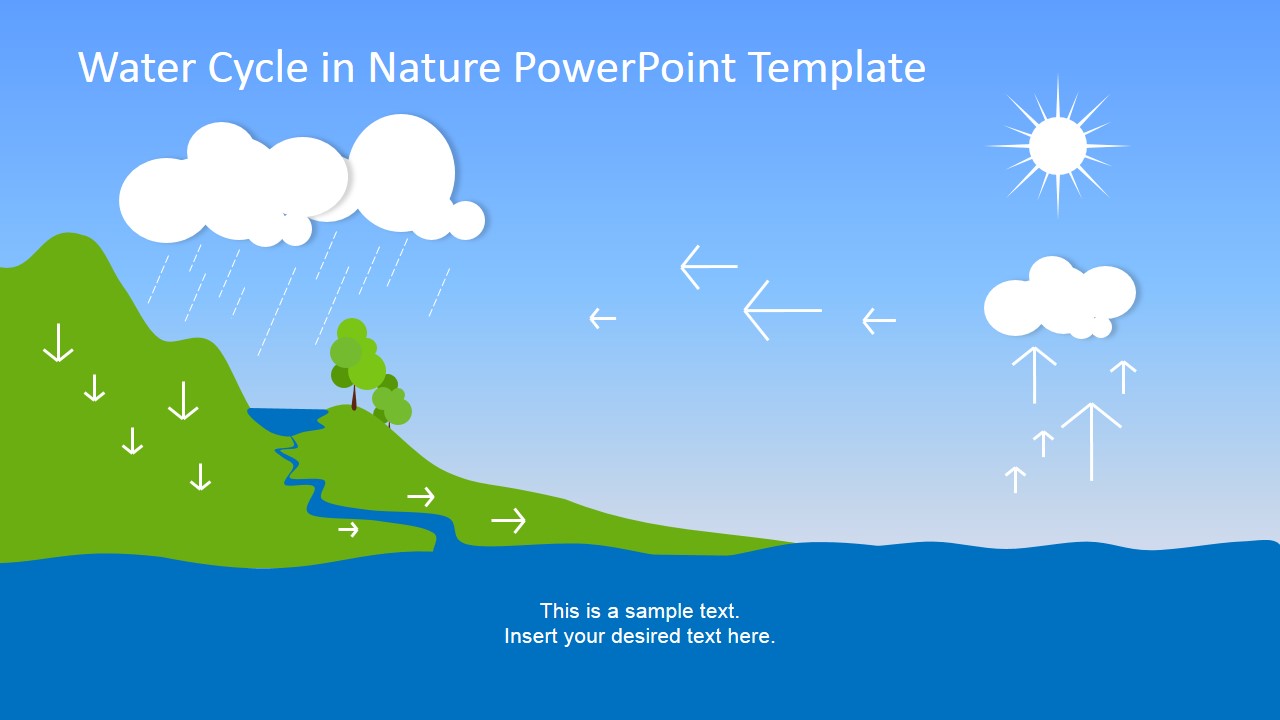
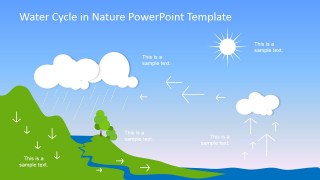
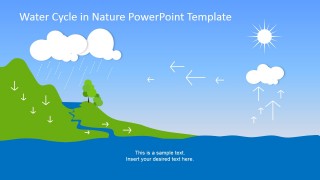
Water Cycle PowerPoint Template is an amazing PowerPoint presentation template of the water cycle process. The water cycle process is the path water takes as it circulates from the land to the sky and back again. The water cycle diagram is the pictorial presentation of this path. The water cycle template is made up of four steps namely: evaporation, condensation, precipitation and collection.
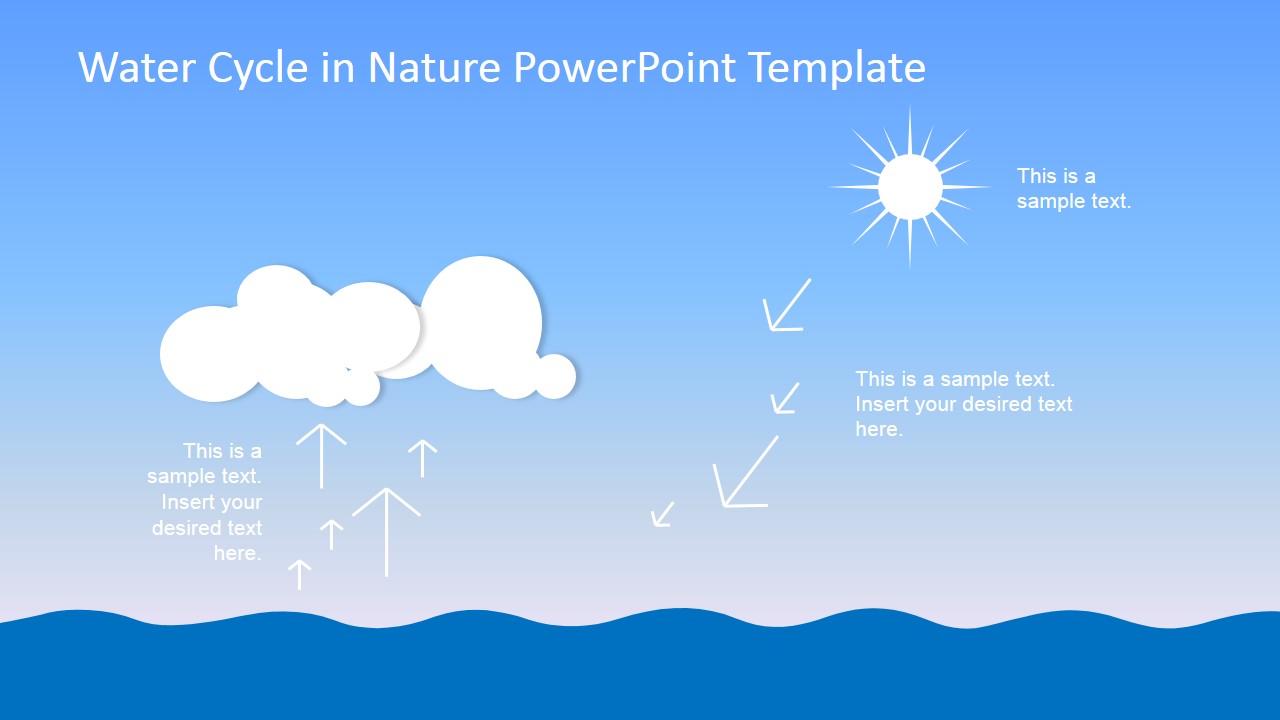
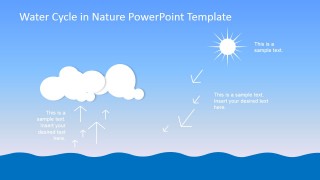
- Evaporation: the sun heats up water in rivers, lakes and oceans and turns it into vapor or steam. The water vapor or steam leaves the river, lake or ocean and goes into the air.
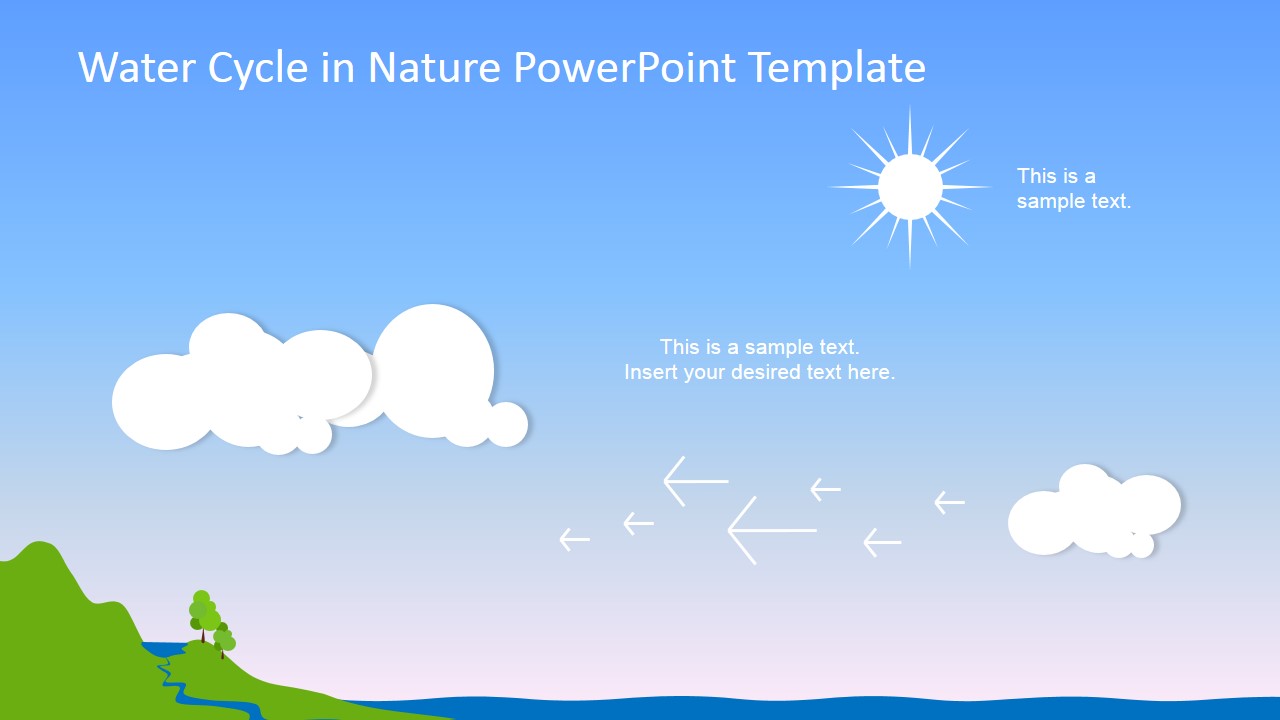
- Condensation: water vapor in the air gets cold and changes back into liquid, forming clouds
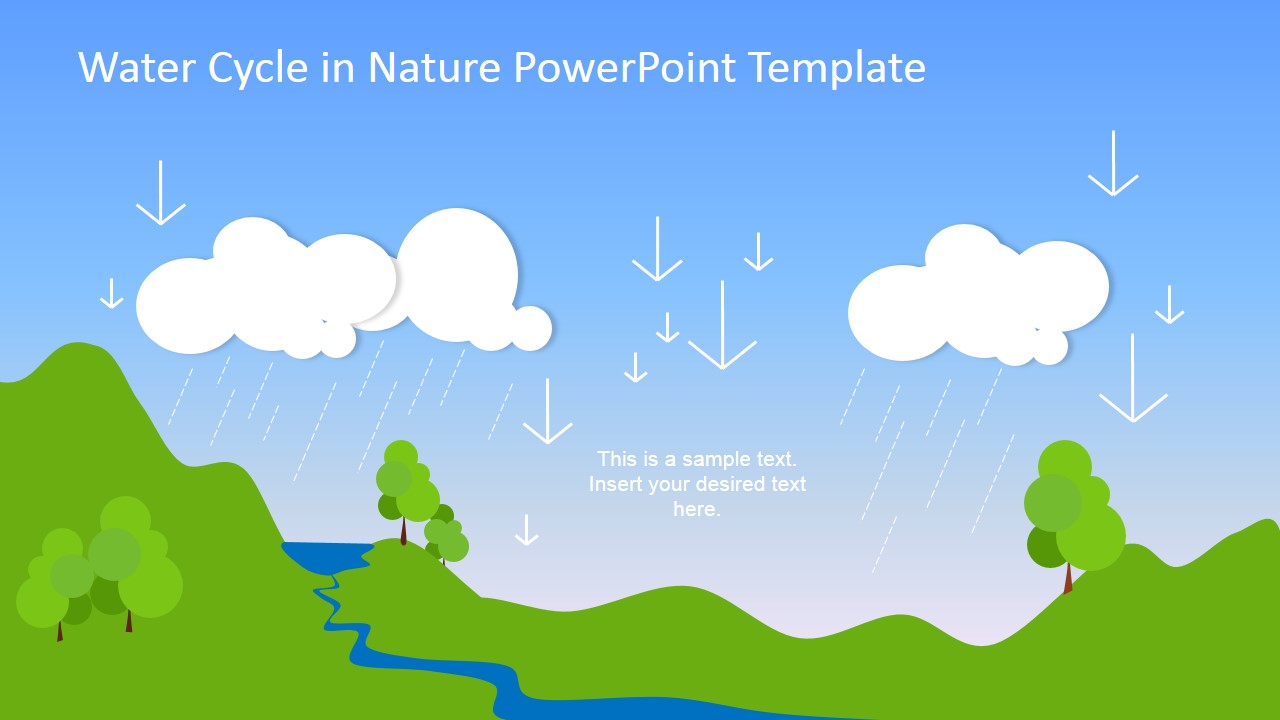
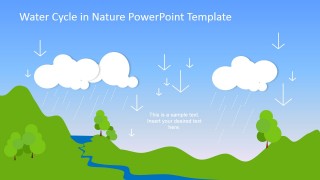
- Precipitation: as more water condenses, the capacity of air to hold it declines. The clouds get heavy and water falls back to the earth in form of rain.
- Collection: as the water falls to the earth it may end up in the oceans, lakes, rivers or on land. When it ends up on land, it will either soak into the earth and become part of the ground water or it may run over the soil and collect in the oceans, lakes or rivers. It is this water that ends up in rivers, lakes and oceans that restarts the water cycle.
By presenting these steps in form of editable professional PowerPoint templates, it facilitates an aesthetic explanation of the water cycle in a simplistic manner. The water cycle pictorial presentation, other than being used to illustrate the water cycle for kids, can also be used for water cycle definition.
By combining this brief presentation with the pre-prepared attractive slides, one is assured that the presentation of the water cycle can be modified to suit whichever context without missing out the key facts.
All the objects are created as 100% Editable PowerPoint Shapes. Each shape can change in appearance (size, color, effects) without loosing visual quality. The user can apply this PowerPoint shapes to existing presentations and improve the visual quality of existing lectures.
What’s inside this template
Example presentation scenarios
- A science teacher can introduce the full water cycle with Slide 1, using the landscape diagram to connect rain, river flow, evaporation, and cloud formation in one view.
- An environmental trainer can explain evaporation and condensation with Slide 2, using the ocean surface, clouds, sun, and upward arrows to focus the audience on phase change.
- A curriculum designer can build a lesson segment on precipitation with Slide 4, using the rainy watershed scene and downward arrows to explain how water returns to land.
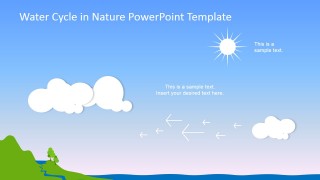
- A public education presenter can summarize water movement with Slide 5, using the combined rain, runoff, wind, and evaporation arrows as a recap diagram.
Features
- 100% editable presentation template
- Compatible with Microsoft PowerPoint and Google Slides
- 16:9 aspect ratio slides
- Scalable vector shapes, icons and illustrations
- AI-Ready for Microsoft Copilot and Claude
- Instant access and download
Frequently asked questions
Q: How should a presenter explain the water cycle clearly with this template?
A: Start with the full landscape diagram to establish the whole system, then move to the step-focused slides for evaporation, precipitation, and runoff. Keep each label short and place the spoken explanation on one process at a time. The arrows already guide direction, so the presenter should use narration to connect cause and effect.
Q: Who is this template best suited for?
A: This template is best for teachers, environmental educators, and trainers who need to explain a physical process to a nontechnical audience. The visual scenes work well for classrooms, science fairs, sustainability workshops, and introductory ecology lessons where a diagram is easier to understand than dense text.
Q: Why does the landscape metaphor make the concept easier to follow?
A: The slides place sky, mountains, rivers, and ocean in familiar positions, so the audience can track water through a real-world mental model. Arrows turn the landscape into a process map: upward arrows signal evaporation, downward arrows signal precipitation, and river arrows show collection and runoff.
Water Cycle PowerPoint Template
5-slide presentation template for water cycle diagrams, precipitation scenes, and runoff explanation
Water Cycle PowerPoint Template is a 5-slide science diagram deck for explaining evaporation, condensation, precipitation, runoff, and collection. It includes a full landscape cycle diagram, ocean evaporation arrows, a cloud movement scene, and rainy watershed variants. Built for educators, trainers, and environmental presenters in Microsoft PowerPoint and Google Slides.
- Category
- Shapes
- Rating


 Loading...
- Aspect ratio
- 16:9
- Item ID
- 6680-01
- Colors
 Microsoft PowerPoint
  Microsoft Copilot
  Claude for PowerPoint
 Other formats supported
Subscribe today and get immediate
access to download our PowerPoint templates.