Edit our Urine Color Chart Slide Template for PowerPoint to present the urine test reports clearly and comprehensively. Urine color is often checked to see how well-hydrated a person is. Some certain medicines and foods can change the color of the urine. This color change can also result from an infection or a physiological problem related to the liver or kidneys. So, a urine color test is a good indicator to identify these issues. The urine color chart template helps professionals display the urine color test findings and explain the significance of hydration. Moreover, users can utilize this template for education purposes in classes and training sessions. We have created this chart template using 100% editable PowerPoint elements. There are different uses of this template:
- Medical professionals can use this urine chart template to showcase the results of the urine color test to their patients.
- Professors can utilize the template to educate their students about the importance of hydration and their identification test related to urine color.
- Biology students can use this template to create amazing class presentations about urinalysis.
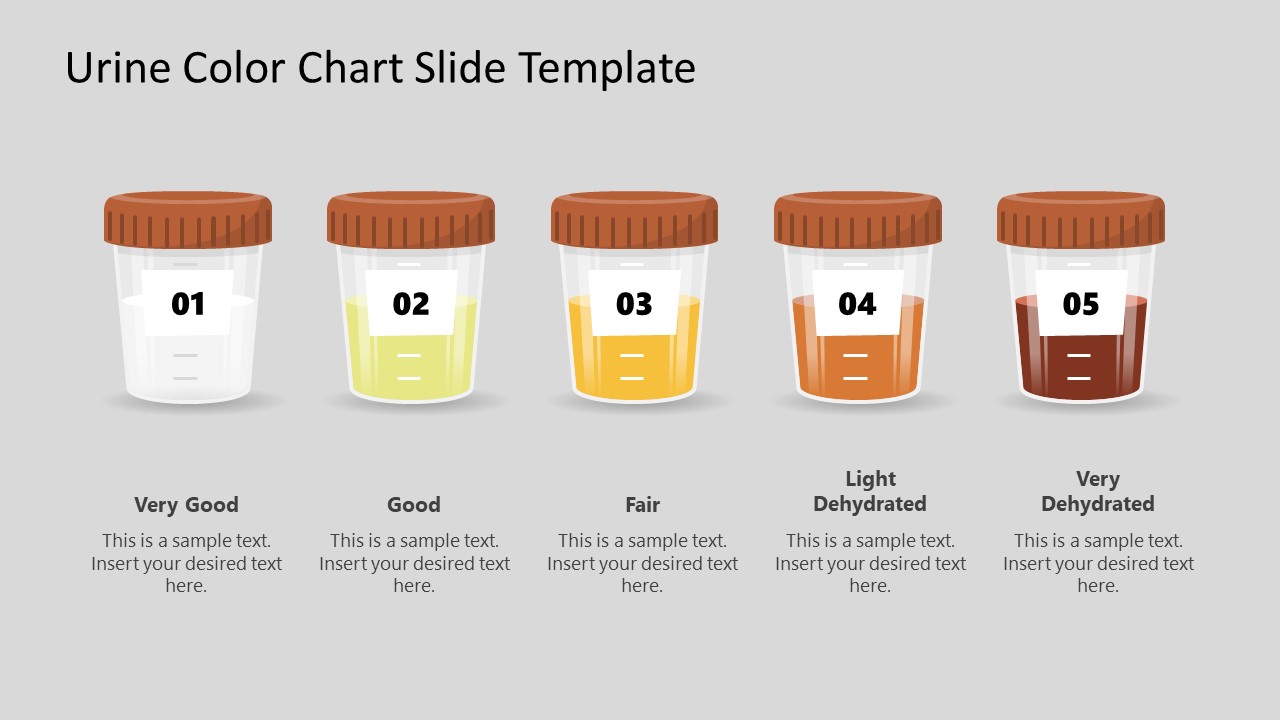
Our Urine Color Chart Slide Template for PowerPoint consists of five slides. The first slide contains a urine color chart diagram showing a vial with color gradation labeled with respective hydration levels. The second slide also helps professionals display the chart in a different layout. The slide three diagram contains five urine containers with samples, and editable rectangular text boxes are provided below each container to demonstrate the necessary details about the patient. The slide four and five show a single individual specimen container with specific lab results. This urine color chart template is compatible with all PowerPoint versions, Google Slides, and Keynote. The users can change the shapes and effects used in this PPT slide template and utilize the textboxes to mention the relevant details about the topic. So, download this creative PowerPoint template and try it now! Alternatively, you can download other PPT templates and slide designs for PowerPoint & Google Slides.
What’s inside this template
Example presentation scenarios
- A clinician can use the vertical color scale and single specimen result slide to explain a patient's urine color observation during a hydration counseling discussion.
- A biology instructor can use the five-specimen comparison row to teach students how visual urine color categories relate to hydration status.
- A laboratory trainer can use the callout chart to introduce how sample appearance is reported before discussing confirmatory testing and clinical context.
- A nursing student can use the specimen cup slides to present a class assignment on urinalysis indicators and patient communication.
Features
- 100% editable presentation template
- Compatible with Microsoft PowerPoint and Google Slides
- 16:9 aspect ratio slides
- Scalable vector shapes, icons and illustrations
- AI-Ready for Microsoft Copilot and Claude
- Instant access and download
Frequently asked questions
Q: How should a presenter explain the urine color scale without making it sound like a diagnosis?
A: Start with the vertical color scale as an observation guide, then state that urine color can suggest hydration status but does not replace clinical assessment. Use the callout cards to describe each category in plain language, and reserve the single specimen slides for examples that need context, follow-up questions, or additional testing.
Q: Who is this template best suited for in a health or education setting?
A: This template fits clinicians, nursing educators, lab trainers, and biology students who need a simple visual reference for urine color discussion. It works best when the goal is to inform an audience about hydration indicators, compare specimen appearances, or explain a basic urinalysis concept without presenting a full diagnostic workup.
Q: Why do the specimen cup and vial visuals help communicate this topic?
A: The specimen cup and vial metaphors make the scale feel connected to a real sample rather than an abstract color strip. The row of five containers supports quick comparison, while the single specimen slides slow the discussion down for one case. This sequencing helps audiences move from general pattern recognition to focused interpretation.




Urine Color Chart Slide Template for PowerPoint
5-slide presentation template for urine color charts, hydration levels, and urinalysis education
Urine Color Chart Slide Template for PowerPoint is a 5-slide medical diagram deck for explaining urine shade, hydration status, and urinalysis observations. It includes a vertical color scale, labeled hydration callouts, a five-specimen comparison row, and single specimen result slides for clinicians, educators, and students in Microsoft PowerPoint and Google Slides.
- Category
- Diagrams
- Rating

 Loading...
- Aspect ratio
- 16:9
- Colors
 Microsoft PowerPoint
 Microsoft Copilot
 Claude for PowerPoint
Other formats supported
Subscribe today and get immediate
access to download our PowerPoint templates.