The Wellness Continuum PowerPoint Template features the alternative medicine concept introduced by John W. Travis. This presentation provides four diagram templates to describe the overall state of wellbeing. These diagrams provide a famous wellness-illness continuum in the shape of two-way arrows. The additional PowerPoint diagram templates include a 2×2 matrix and gauge/ speedometer template to measure wellness. Moreover, the eye-catching colors and clipart will help in an effective and engaging presentation about the Illness-Wellness continuum.
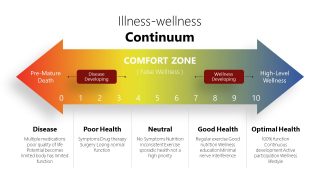
The concept of Illness-Wellness Continuum states that there are many degrees of wellness as well as illness. The absence of physical symptoms is not sufficient to show wellness. For example, an individual may suffer from depression, anxiety, or low self-esteem. The visual illustration of wellness continuum in PowerPoint display degrees of illness on left slide and wellness on right.
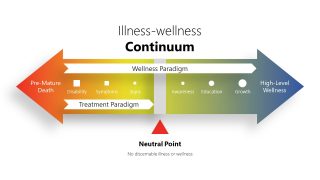
The two arrows represent spectrums as pre-mature death on left and high-level wellness on right. The comfort zone in the middle is a neutral point where there is no visible illness. To achieve wellness, one must move further along the continuum towards an optimal emotional and mental state. The Illness-Wellness continuum suggests that high-level wellness can be achieved through awareness, education, and growth. On the other side, health can get worse by signs of illness, symptoms, and disability. Sometimes it is represented as a wellness wheel.
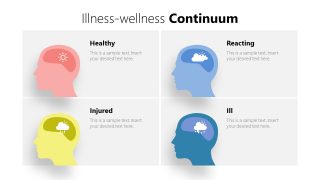
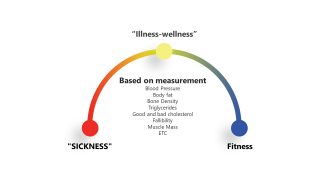
The Wellness Continuum PowerPoint Template consists of fully editable diagrams. These PowerPoint diagrams let users customize colors and text to visualize topics ranging from disease, poor, neutral, good, and optimal health. The matrix of illness wellness continuum includes human head silhouette and use of weather symbols to describe wellness state. Whereas, the gauge diagram is a simple 3-stage measure of sickness, illness-wellness (false wellness), and fitness.
The Wellness Continuum diagram templates could be used by healthcare and HR professionals to promote healthy lifestyle. For example, use the treatment paradigm and wellness paradigm for recovering patients.
What’s inside this template
Example presentation scenarios
- A healthcare educator can teach patients how signs, symptoms, and lifestyle choices relate to the continuum arrow and the neutral point between illness and wellness.
- An HR wellness manager can introduce an employee wellbeing program by using the paradigm comparison arrow to distinguish treatment response from awareness, education, and growth.
- A counselor or coach can discuss emotional state changes with clients using the four-cell matrix of Healthy, Reacting, Injured, and Ill conditions.
- A preventive care presenter can summarize screening metrics with the gauge diagram, connecting measures such as blood pressure, body fat, and cholesterol to sickness, illness-wellness, and fitness.
Features
- 100% editable presentation template
- Compatible with Microsoft PowerPoint and Google Slides
- 16:9 aspect ratio slides
- Scalable vector shapes, icons and illustrations
- AI-Ready for Microsoft Copilot and Claude
- Instant access and download
Frequently asked questions
Q: How should a presenter explain the continuum without making the slide feel like a medical diagnosis?
A: Frame the arrow as an educational model, not a diagnostic scale. Start with the neutral point and comfort zone, then explain how behavior, awareness, education, and growth can move a person toward high-level wellness. Keep the health state labels broad and use the text blocks for examples relevant to the audience.
Q: Who is this template best suited for in a wellness presentation?
A: It fits presenters who need to explain wellbeing as a progression: healthcare educators, HR wellness leaders, counselors, and coaches. The continuum arrow supports conceptual teaching, the matrix helps compare visible states, and the gauge works for summarizing screening or wellness measurement categories in a concise closing visual.
Q: Why use arrows, head silhouettes, and a gauge for this topic?
A: The visual metaphors help audiences understand different kinds of movement. The long arrows show progression across health states, the head silhouettes connect the model to mental and emotional wellbeing, and the gauge turns abstract wellness into a readable position between sickness and fitness. This makes the concept easier to discuss.


The Wellness Continuum PowerPoint Template
4-slide presentation template for wellness continuum diagrams, paradigm arrows, matrix states, and gauge visuals
The Wellness Continuum PowerPoint Template is a 4-slide diagram set for explaining the illness-wellness model in Microsoft PowerPoint and Google Slides. It includes a numbered continuum arrow, paradigm comparison arrow, four-cell mental state matrix, and sickness-to-fitness gauge for healthcare, HR, coaching, and wellness education presentations.
- Category
- Diagrams
- Rating

 Loading...
- Aspect ratio
- 16:9
- Item ID
- 20712-01
- Colors
 Microsoft PowerPoint
 Microsoft Copilot
 Claude for PowerPoint
Other formats supported
Subscribe today and get immediate
access to download our PowerPoint templates.