Slide 12 of 15 from Stakeholder Presentation PowerPoint Template
Resource Allocation PPT Slide with Data Visualizations
Resource Allocation Overview Slide
- Chart
- Bar Horizontal
- Evaluation Slide
- 16:9
- 100% Editable
The Resource Allocation Overview slide from the Stakeholder Presentation PowerPoint Template offers a clear evaluation of budget distribution and project metrics using editable slides with charts and vector icons. This layout supports business presentations by visually summarizing resource data for stakeholder insights.
What’s on This Slide
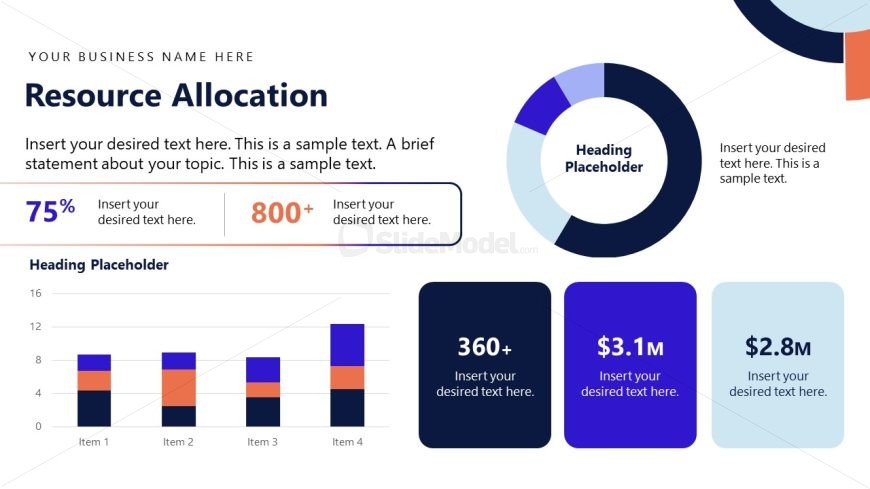
The layout features a title at the top left, stating 'Resource Allocation.' Below, a percentage figure is prominently displayed in a large font, followed by a numeric placeholder. To the right, a circular chart is positioned, with a heading placeholder inside. Below this, a bar chart occupies the left side, displaying four bars labeled 'Item 1' through 'Item 4.' Each bar is segmented into two colors. On the right, three rectangular boxes present numerical placeholders. The background is light with dark text, creating a clear visual hierarchy.
How to Use It
This layout serves to present resource allocation data effectively, combining visual elements like charts and numerical data. It fits within a business presentation sequence, typically following sections that outline project goals or financial overviews. This structure is useful for stakeholders needing a concise summary of resource distribution, budget allocations, or project metrics, allowing for quick comprehension of key figures and trends.
Text Placeholders & Capacity
Keep your copy within these limits so it fits without resizing. Body slots can hold roughly 10-15 words each.
| Placeholder | Count | Max characters (approx.) |
|---|---|---|
| Slide title | 1 | 30 |
| Body paragraph | 1 | 100 |
| Item heading | 4 | 10 |
| Item body | 4 | 10 |
| Kpi value | 3 | 10 |
Slide Keywords
Download unlimited PowerPoint templates, charts and graphics for your presentations with our annual plan.
DOWNLOADReturn to Stakeholder Presentation PowerPoint Template.