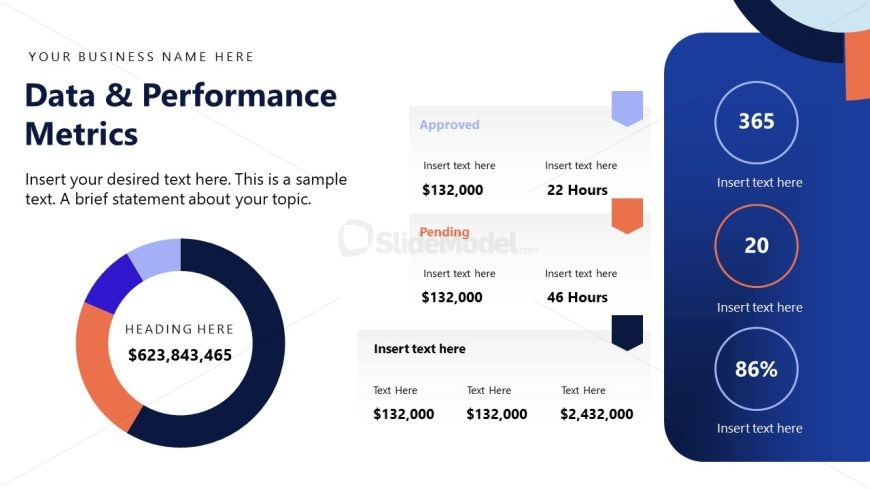
Slide 8 of 15 from Stakeholder Presentation PowerPoint Template
Data and Performance Metrics Slide – Stakeholder Presentation Template
Data & Performance Metrics Slide
- Chart
- Other
- Evaluation Slide
- 16:9
- 100% Editable
The Data & Performance Metrics slide from the Stakeholder Presentation PowerPoint Template offers a clear layout for presenting financial and project status data. This slide template includes editable shapes and tables alongside a circular chart, making it suitable for business presentations and stakeholder meetings that require detailed performance evaluations within a slide deck.
What’s on This Slide
The layout features a circular chart on the left displaying a total value, with a heading above it. To the right, there are two sections labeled 'Approved' and 'Pending,' each containing a table with two columns for financial figures and time metrics. Below these sections, there are additional text placeholders for further details. The circular chart is visually prominent, while the tables are aligned vertically. Text placeholders are present for headings and body text, with a clear visual hierarchy emphasizing the circular chart and the labeled sections.
How to Use It
This layout serves as a performance metrics overview, suitable for presenting key data in a business context. It fits well in a sequence after introductory slides, providing a detailed look at financial performance and project statuses. This structure is useful for stakeholders needing a quick summary of approved and pending metrics, making it ideal for project updates, financial reviews, or performance assessments.
Text Placeholders & Capacity
Keep your copy within these limits so it fits without resizing. Body slots are tight, roughly 10-15 words each.
| Placeholder | Count | Max characters (approx.) |
|---|---|---|
| Slide title | 1 | 30 |
| Body paragraph | 1 | 100 |
| Item heading | 2 | 20 |
| Item body | 2 | 50 |
| Item body | 1 | 150 |
Slide Keywords
Download unlimited PowerPoint templates, charts and graphics for your presentations with our annual plan.
DOWNLOADReturn to Stakeholder Presentation PowerPoint Template.