Software Diagrams for PowerPoint – Today software industry is proliferating, and Software Engineering is becoming one of the most demanded disciplines in the globalized economy. Through the last three decades, Software Engineering has developed different formalized standards for Software Design that visually document the software components and behavior; examples are the Unified Modelling Language (UML) and the Business Process Modelling Language (BPML). In the last years, the industry has identified that formal documentation of software products can be too expensive if the required software is short-lived or in constant evolution. In response to these findings, Agile software methodologies were born due to heavily documented projects where the assets were the documents and not the working product. Agile projects still create recorded assets, but in a much lighter fashion, to describe software components’ modularity, high-level interactions, and dependencies.
Our Software Diagrams for PowerPoint is a professional PowerPoint template that provides generic elements for creating Software Diagrams in PowerPoint. Fifteen different diagrams are provided to illustrate how the user can create their diagrams or edit them and adapt them to their diagram. Each element is created with PowerPoint shapes, allowing the user to customize their appearance fully, and create modern Flat diagrams just dragging and dropping components along with the PowerPoint Slide canvas.
The Software Diagrams Provided are:
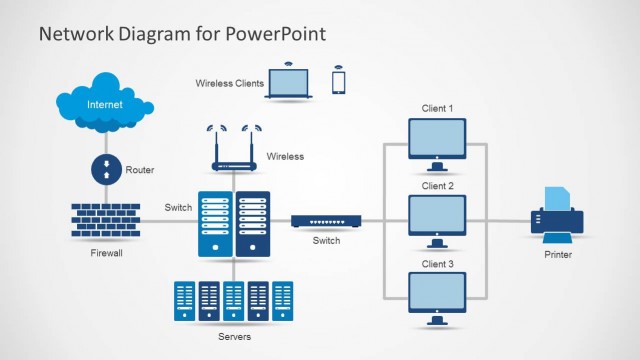
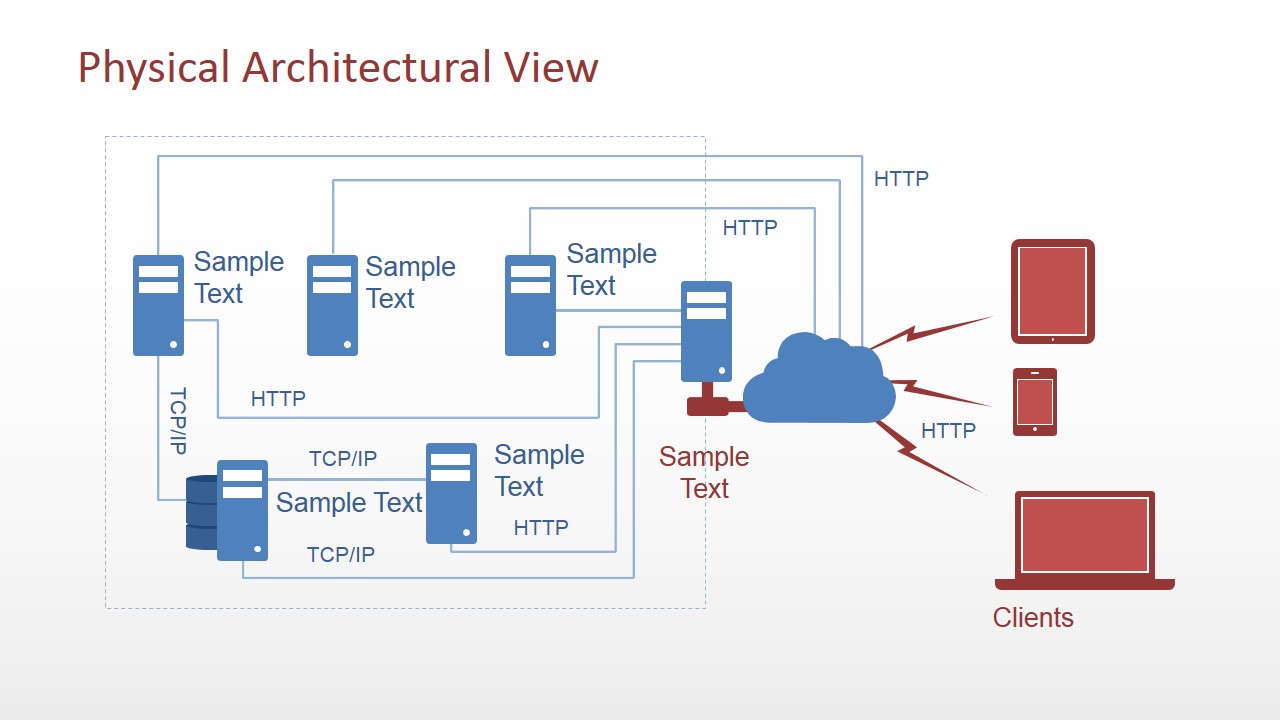
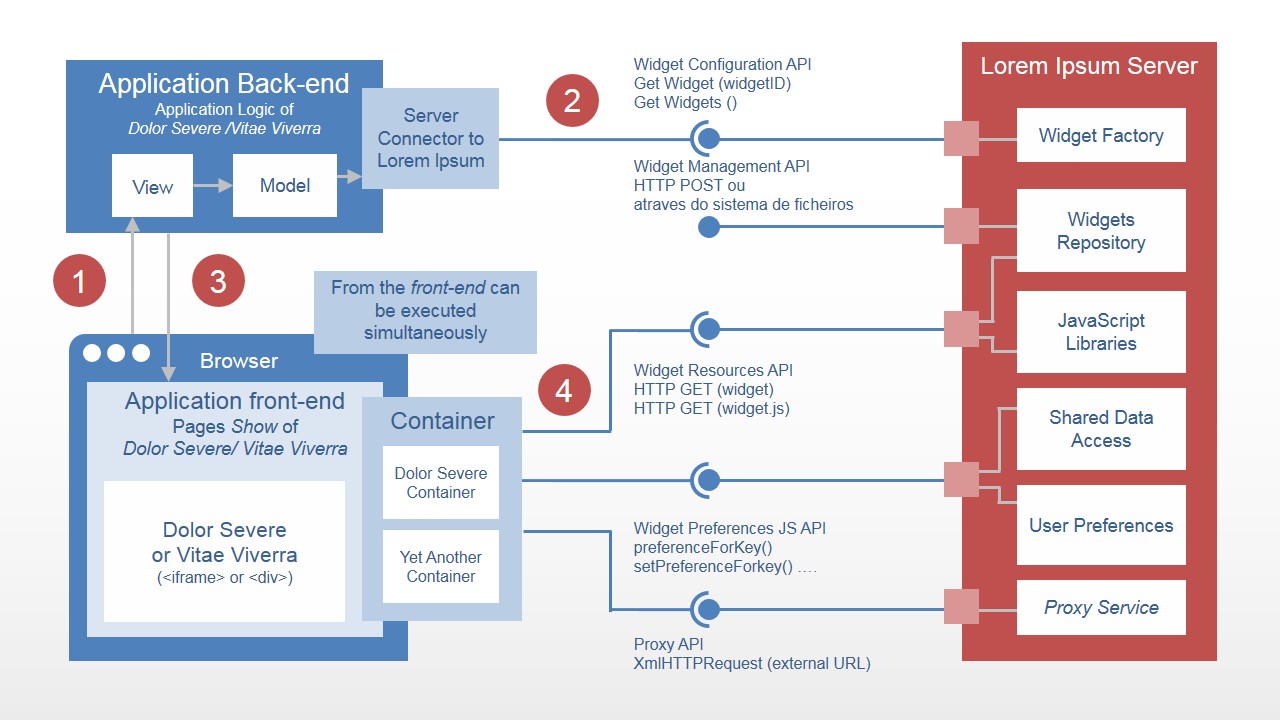
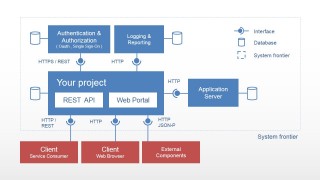
- Physical Architectural Network Diagram: Servers, Network connections, protocol metaphor shapes, and devices.
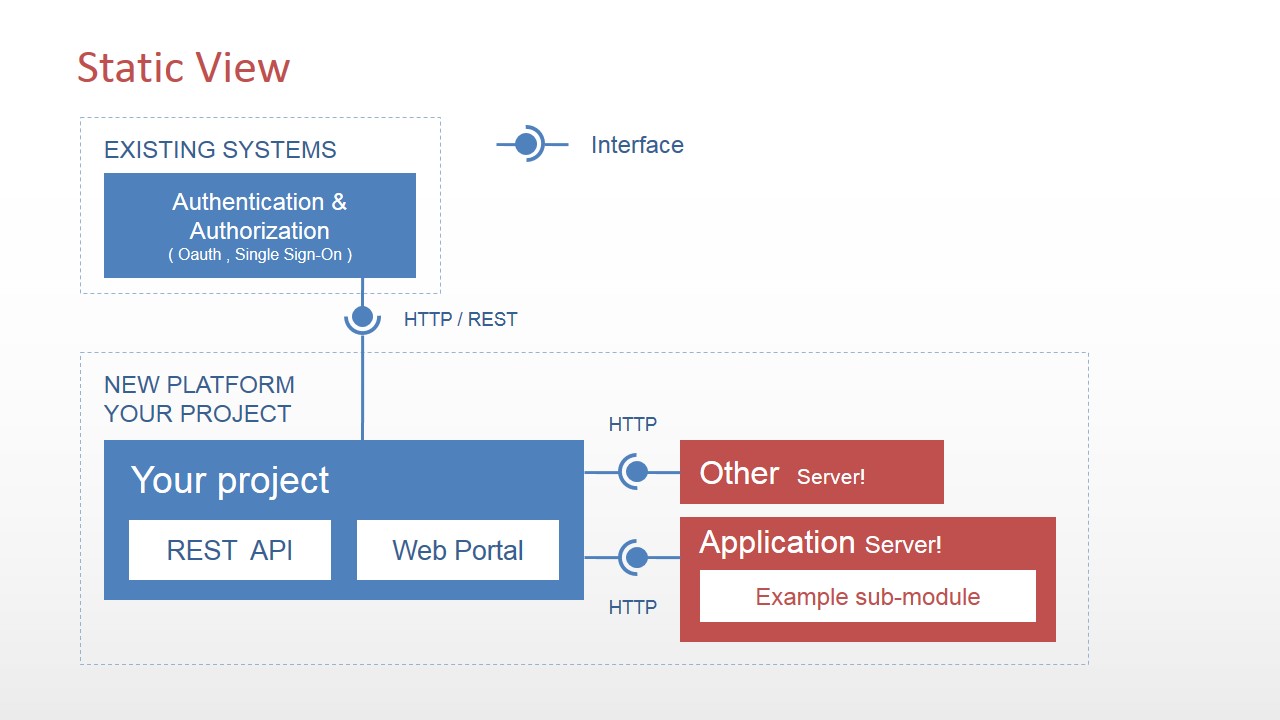
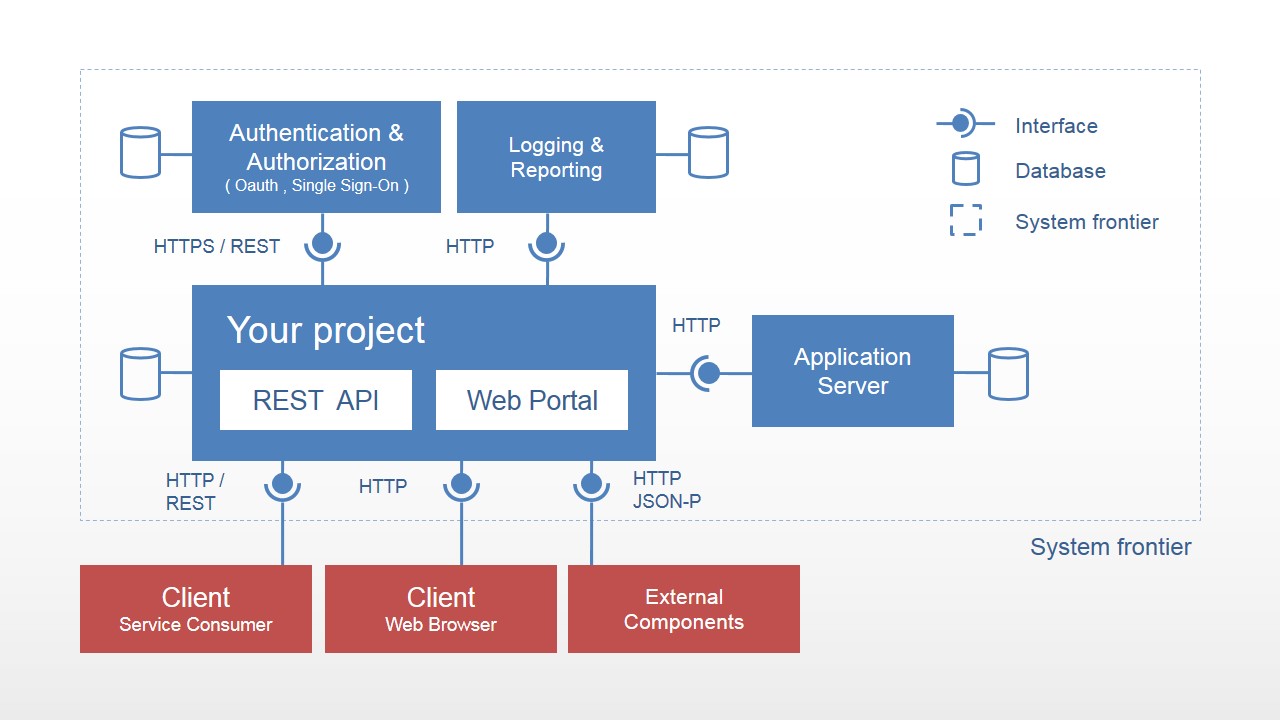
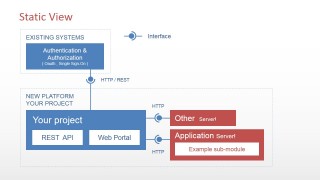
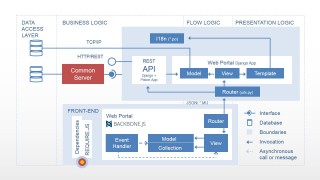
- Static Block Diagram: Modules, Classes, Databases, Boundaries, and Interfaces.
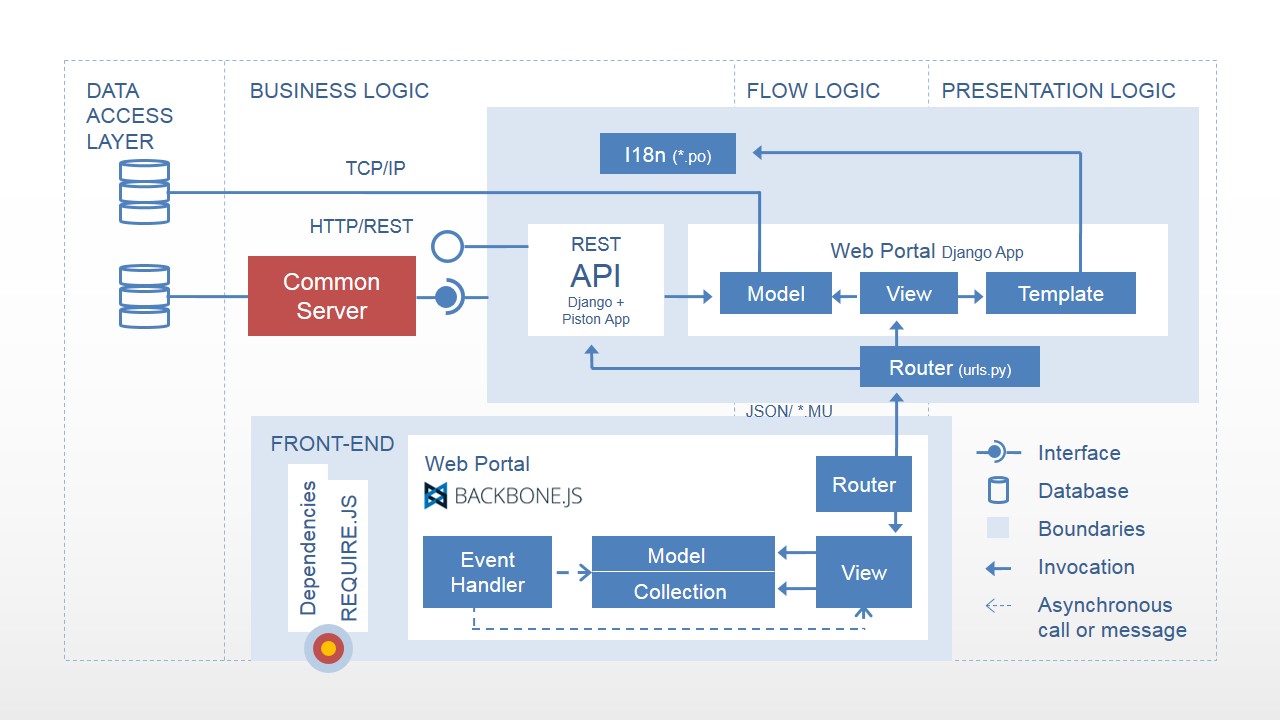
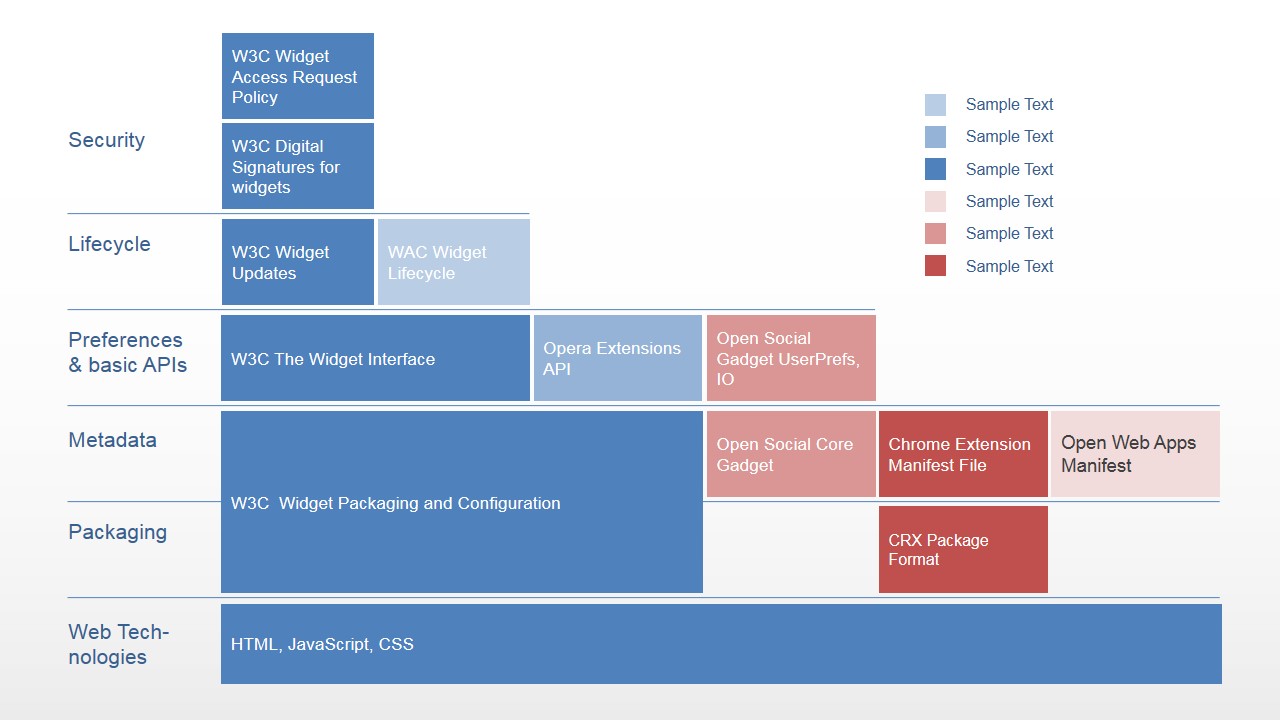
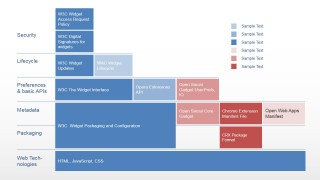
- Layered Diagrams: Layers, Modules, and Stacked Descriptions.
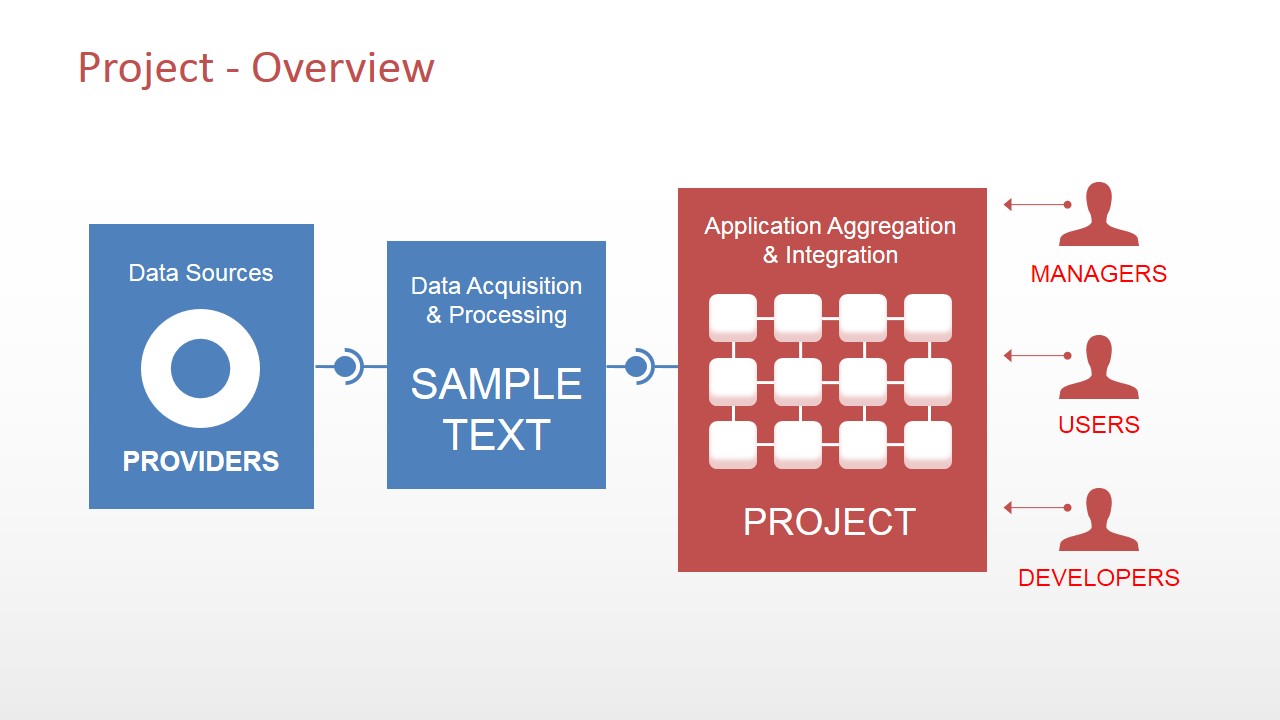
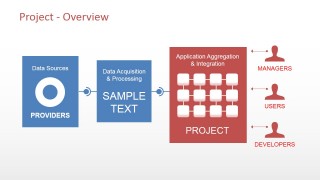
- Project Overview Diagram: Modules Blocks and People Roles.
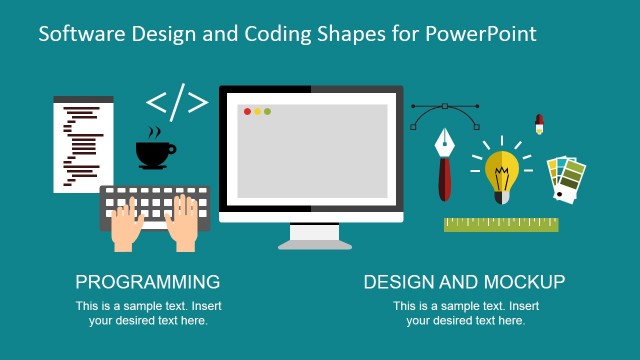
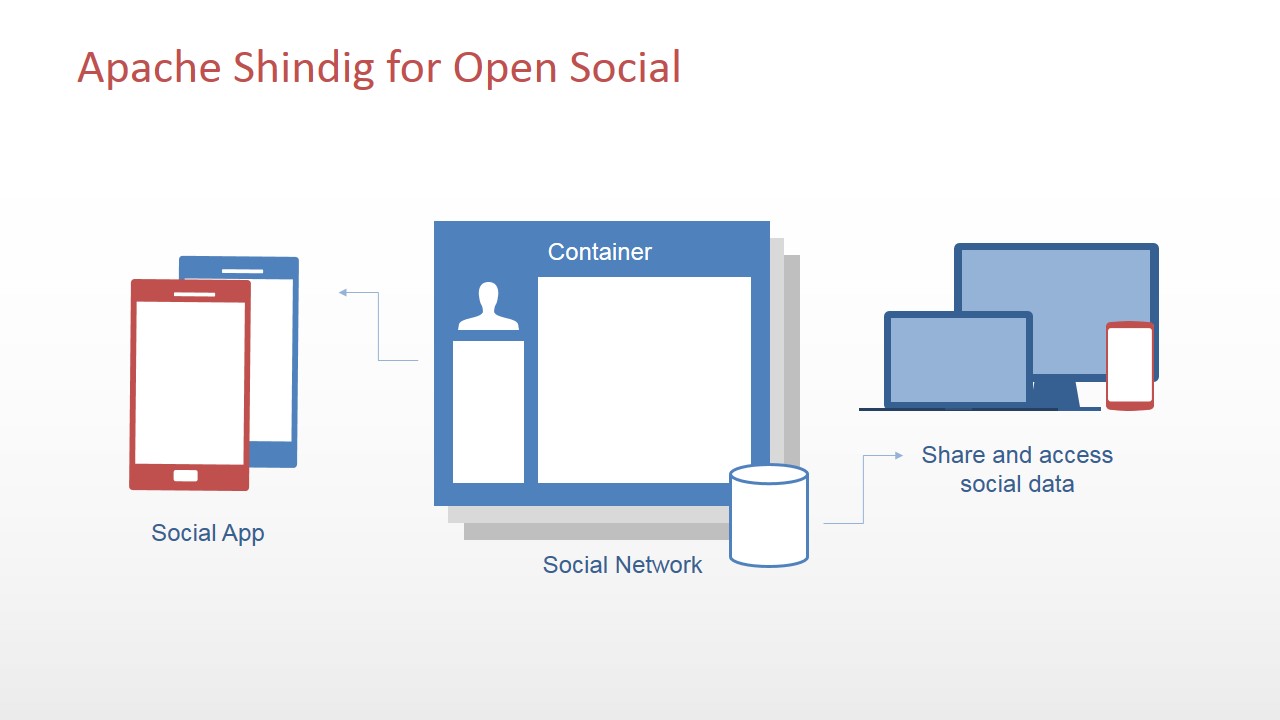
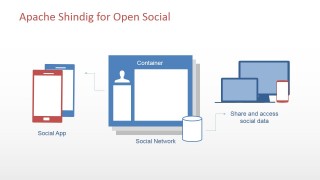
- Software Clipart: Devices, Containers, PC’s, Software Icons.
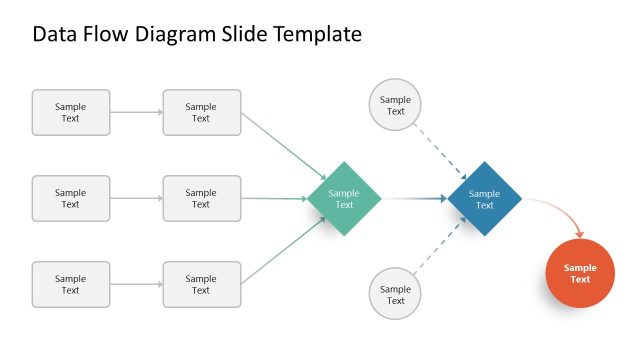
- Data Flow Diagrams: Nodes and connectors.
- Navigation Flow Diagram: Screens, Components, Modules, Interactions Sequence.
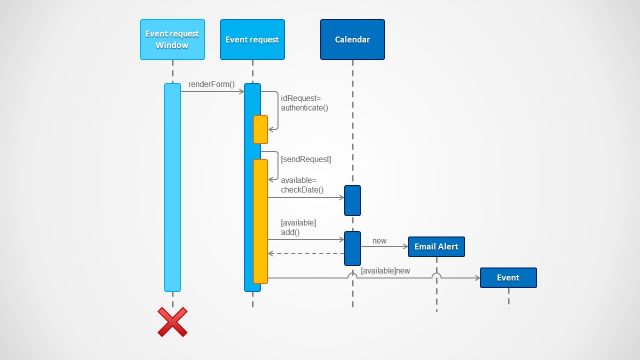
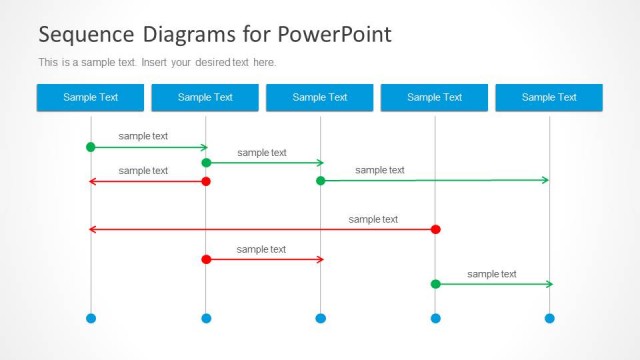
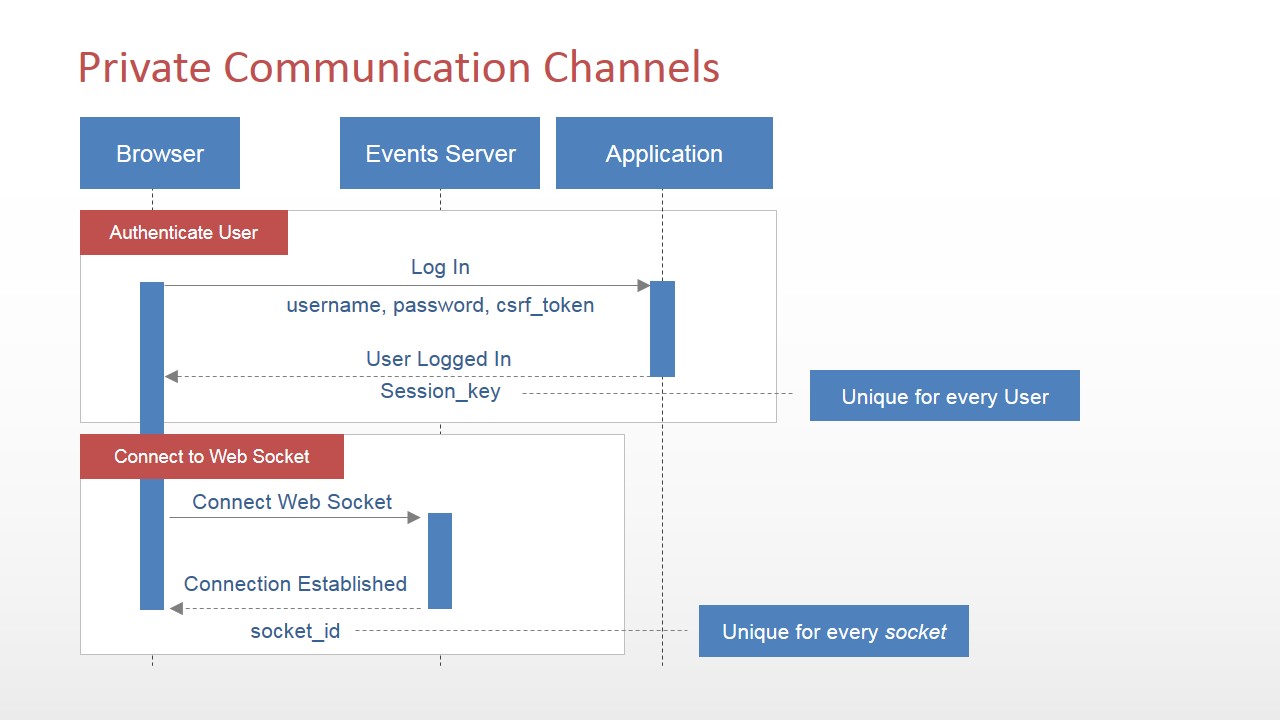
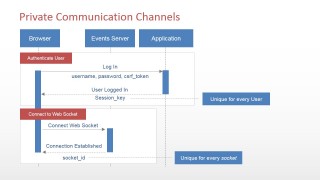
- Sequence Diagram: UML Sequence Diagram.
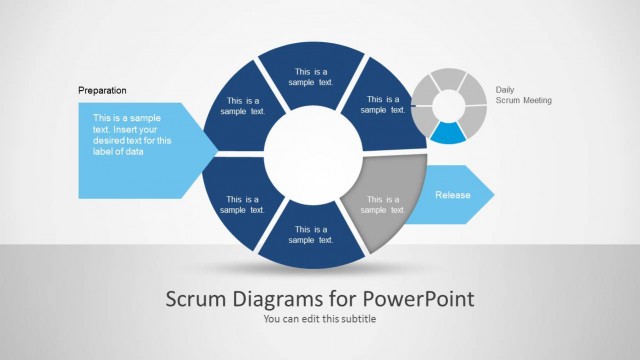
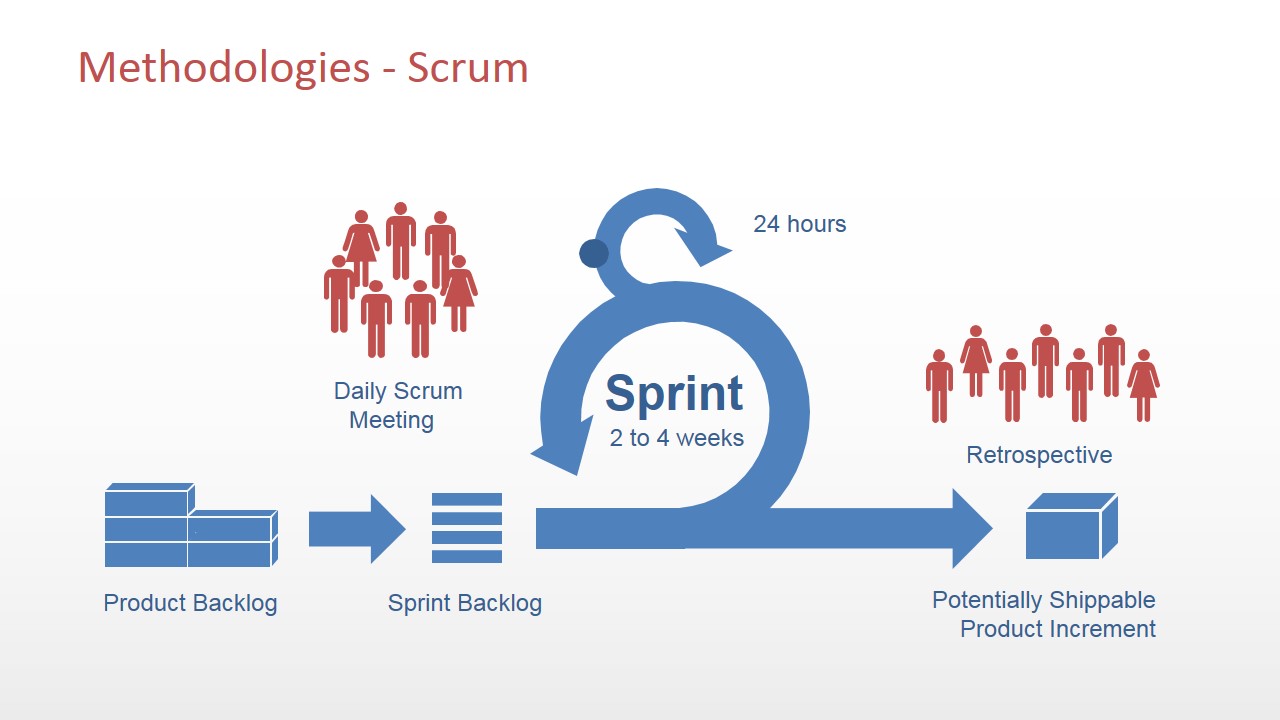
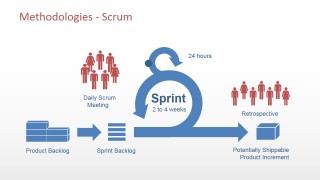
- Scrum Methodology Diagram: Scrum diagram cycles view.
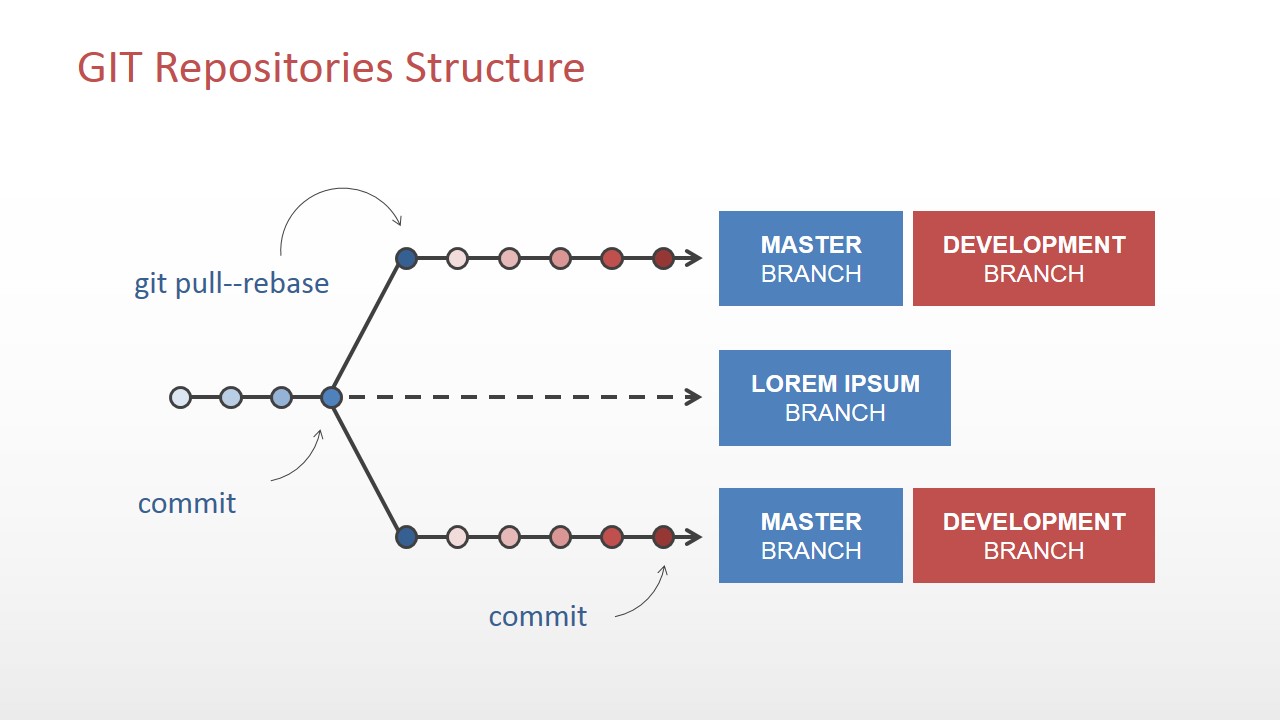
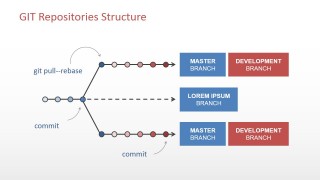
- GIT Repository Structure: Branches, revision nodes, and actions.
Create professional Software Diagrams in PowerPoint which are easy to read. Communicate your software structures and interactions with PowerPoint and easily share your stakeholders. Impress your team with flat design Software Diagrams that appeal to global audiences.
Alternatively, you can download other tech stack diagram designs and presentation slides for software presentations or technology stack templates.
What’s inside this template
Example presentation scenarios
- A software architect can present a system design review to engineering leaders using the physical architectural view and static view diagrams to explain components, interfaces, and boundaries.
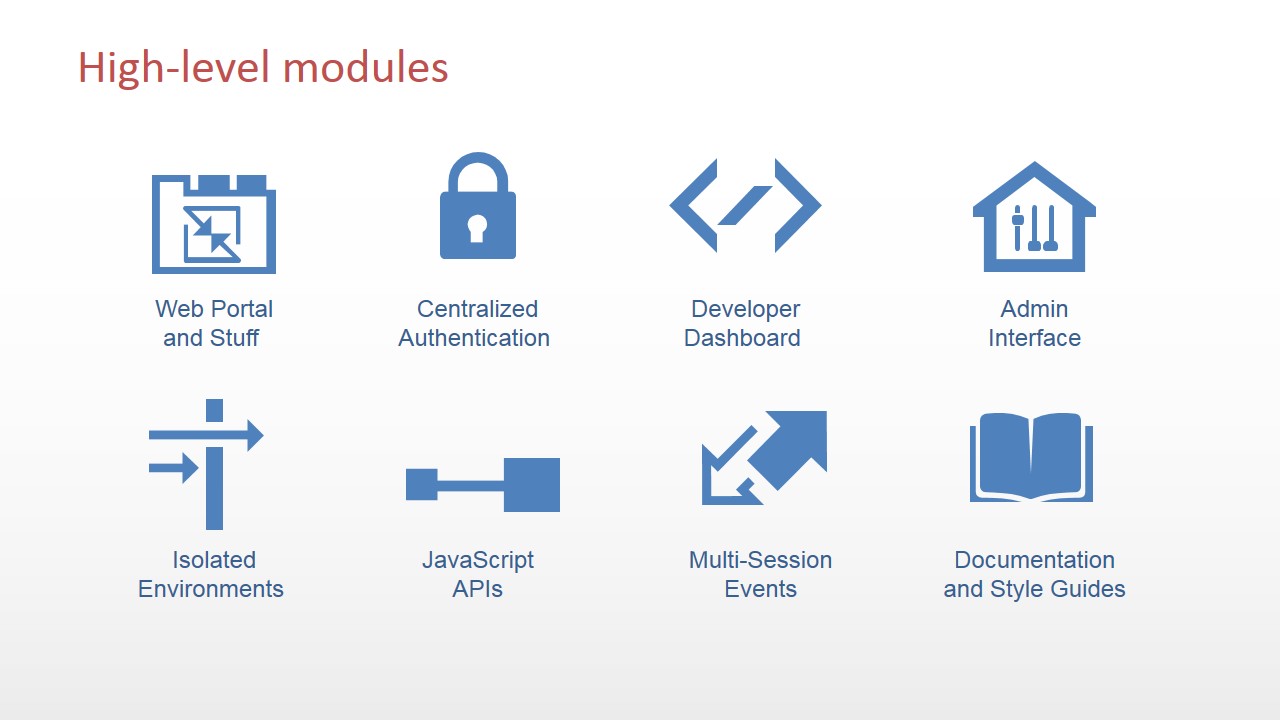
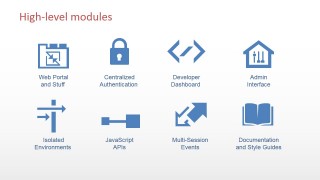
- An engineering manager can brief business stakeholders on project scope using the project overview slide and high-level modules icon grid to connect data sources, users, roles, and application capabilities.
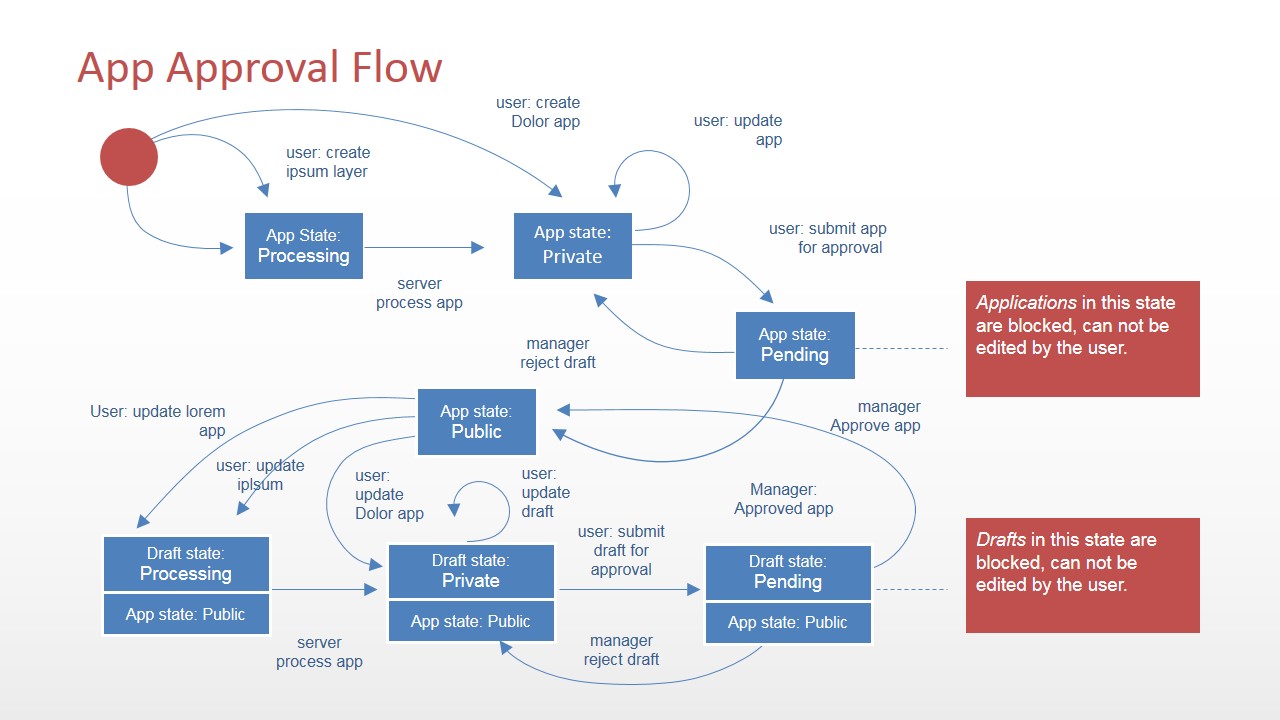
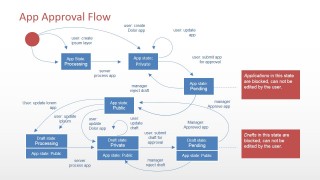
- A technical project lead can explain release workflow to a product team using the app approval flow, Scrum methodology slide, and Git repositories structure diagram.
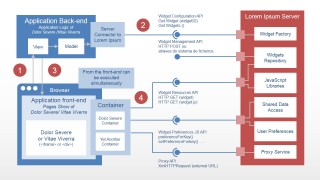
- A solution consultant can map an integration proposal for a client using the layered architecture, private communication channels sequence diagram, and application server diagrams.
Features
- 100% editable presentation template
- Compatible with Microsoft PowerPoint and Google Slides
- 16:9 aspect ratio slides
- Scalable vector shapes, icons and illustrations
- AI-Ready for Microsoft Copilot and Claude
- Instant access and download
Frequently asked questions
Q: How should a presenter explain a complex software system with this template without overwhelming the audience?
A: Start with the project overview to establish the main actors and data sources, then move into the physical or static architecture for structure. Use the layered architecture only after the audience understands the big picture. Reserve the sequence diagram and app approval flow for behavior, because they explain how components interact over time.
Q: Who gets the most value from this software diagram template?
A: This template fits software architects, engineering managers, product owners, and solution consultants who need to translate system design into a presentation. It is strongest when the audience includes both technical and business stakeholders, because slides such as the module icon grid and project overview simplify the entry point before showing detailed architecture.
Q: Why does the template mix architecture diagrams, flow diagrams, and methodology slides?
A: Software decisions are rarely explained by one diagram type. The architecture slides show what exists, the flow and sequence slides show how it behaves, and the Scrum and Git slides show how the team works on it. That mix helps the presenter connect system structure, user actions, and delivery process in one discussion.

Software Diagrams for PowerPoint
15-slide presentation template for software architecture diagrams, sequence flows, Scrum, and Git structures
Software Diagrams for PowerPoint is a 15-slide diagram template for explaining software architecture and development workflows. It includes physical architecture, static system, layered architecture, sequence, state flow, Scrum, module icon, and Git repository layouts for technical teams. Designed for Microsoft PowerPoint and Google Slides.
- Category
- Diagrams
- Rating


 Loading...
- Aspect ratio
- 16:9, 4:3
- Item ID
- 6754-01
- Colors
 Microsoft PowerPoint
  Microsoft Copilot
  Claude for PowerPoint
 Other formats supported
Subscribe today and get immediate
access to download our PowerPoint templates.