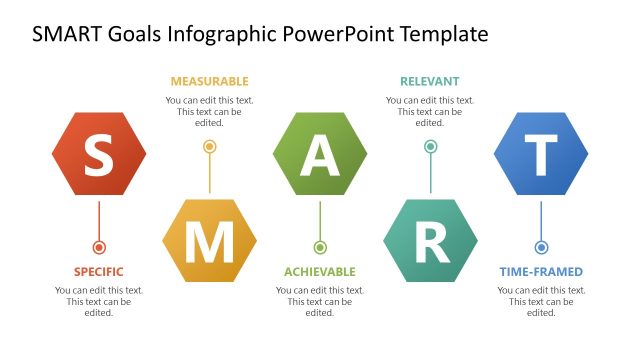
Slide 2 of 6 from SMART Goals Infographic PowerPoint Template
Editable SMART Goals Infographic PPT Template
SMART Goals Infographic Structure
- Diagram
- Other
- Strategic Analysis Slide
- 16:9
- 100% Editable
The SMART Goals Structure slide from the SMART Goals Infographic PowerPoint Template visually breaks down the key elements of effective goal-setting using editable shapes arranged in a clear diagram. This slide is suitable for business presentation decks and training sessions focused on strategic analysis, providing a concise layout to explain Specific, Measurable, Achievable, Relevant, and Time-Framed objectives with vector icons and connecting arrows.
What’s on This Slide
The layout features five hexagonal shapes arranged horizontally. The first hexagon on the left is colored red and labeled 'S' for Specific. The next three hexagons are gray, labeled 'M' for Measurable, 'A' for Achievable, and 'R' for Relevant. The last hexagon is also gray, labeled 'T' for Time-Framed. Each hexagon has a text placeholder centered within it, and there are connecting lines or arrows indicating flow between the shapes. The background is white, enhancing the visibility of the hexagons.
How to Use It
This layout serves as a visual representation of the SMART goals framework, ideal for presentations on goal-setting strategies. It fits well after an introductory slide on business objectives and can be used to discuss each component in detail. This structure is useful in business meetings, workshops, or training sessions focused on effective goal management and performance measurement.
Text Placeholders & Capacity
Keep your copy within these limits so it fits without resizing. Each node can accommodate a title and brief description.
| Placeholder | Count | Max characters (approx.) |
|---|---|---|
| Item heading | 5 | 20 |
| Item body | 5 | 50 |
Slide Keywords
Download unlimited PowerPoint templates, charts and graphics for your presentations with our annual plan.
DOWNLOADReturn to SMART Goals Infographic PowerPoint Template.