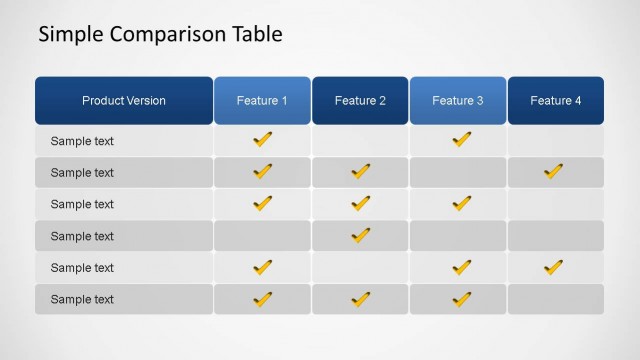
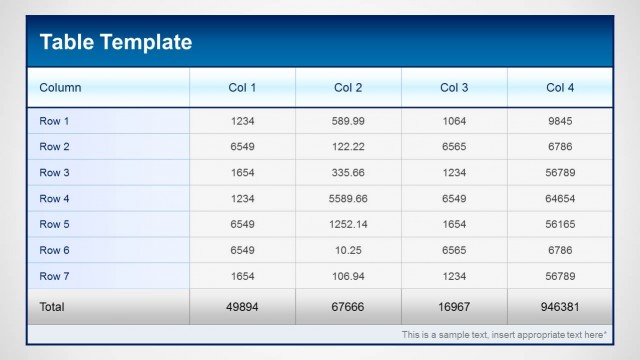
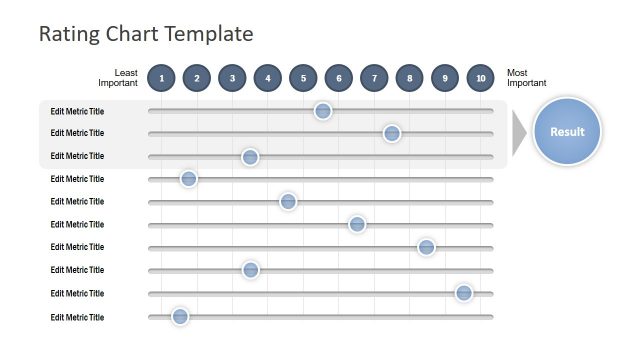
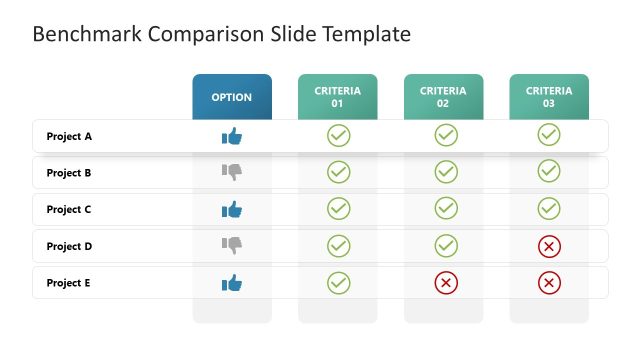
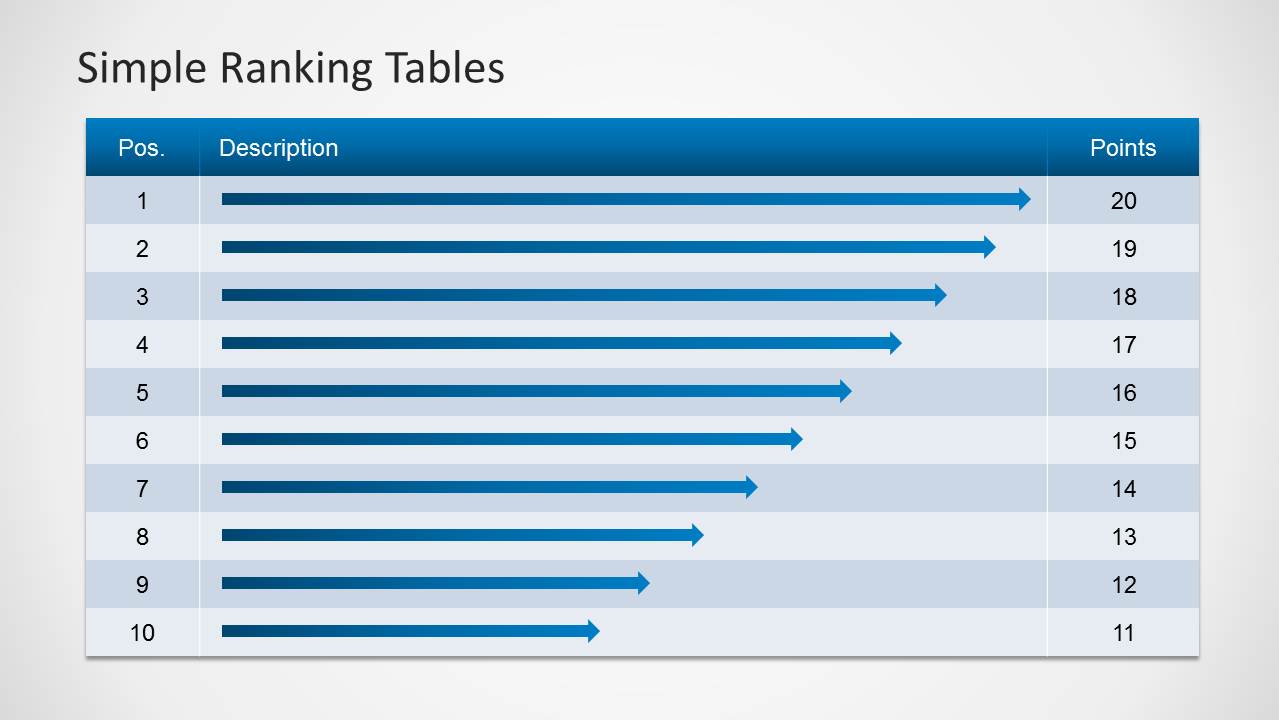
The Simple Ranking Tables Template for PowerPoint is a presentation design containing ranking tables to list items and compare different rankings. Use these tables to quickly summarize information by order of priority, importance, or level of production. Create a helpful infographic that can make processes more competitive, boosting the company’s drive to succeed. The presenter can also use other statistical designs to analyze this data, like the Professional Statistics PowerPoint Icons, which is downloadable from our Gallery.
Rankings are important in determining a specific element’s level of performance, relative to its competitors. It is a concept which is most widely used in sports, gaming, and business. This allows readers to determine the best team, player, or company in the field.
Rankings are specially relevant to businesses. They allow the company to internally gain a greater insight against other businesses in the same field. A higher ranking, for example, on a list detailing the most customer-friendly companies of the year, give the company an advertising method that can entice new clients using the proven and tested ranking entities. This leads to increased sales without increased advertising costs. The rankings themselves help boost company morale, and take advantage of management’s drive to achieve greater.
The rankings can be used in determining the employee of the month, based on a fixed rubric of points. These points can come from established evaluators, such as supervisors or a member of a review committee. The presenter can then insert the related information, using the tables. He can also use Excel spreadsheets built into table designs to quickly sort information by position and number of points.
A blue color palette is applied on the PowerPoint template. This can be changed in the Color Scheme feature of the PowerPoint design. The feature allows the presenter to choose the best colors and themes for the presentation, which make the slides more appealing to a specific audience.
Ideal for company lists and comparisons, the Simple Ranking Tables Template for PowerPoint is fully editable. The presenter can customize the presentation, making it more fitted to the audience and to the presenter.
What’s inside this template
Example presentation scenarios
- An HR manager can present employee-of-the-month results by using the full-width ranking table to show names, positions, and point totals.
- A sales leader can compare regional performance by placing two ranked groups in the side-by-side comparison table with separate captions.
- An operations analyst can explain priority order by using the arrow-bar ranking table and the text callout panel to describe the scoring logic.
- A training facilitator can introduce a competitive leaderboard by showing the 20-position split table and discussing how points decline across ranks.
Features
- 100% editable presentation template
- Compatible with Microsoft PowerPoint and Google Slides
- 16:9 aspect ratio slides
- Scalable vector shapes, icons and illustrations
- AI-Ready for Microsoft Copilot and Claude
- Instant access and download
Frequently asked questions
Q: How should a presenter make a ranked list easier to understand with this template?
A: Start with the full-width ranking table when the audience needs the complete order, then move to the callout layouts when the scoring method needs context. Keep descriptions short, reserve the points column for the decision metric, and use the arrow-bar version when relative rank distance is more important than detailed text.
Q: What presentation situations fit these ranking tables best?
A: This template works best for managers, HR teams, analysts, and team leads who must show ordered results without building a complex dashboard. It fits employee scoring, vendor comparisons, product priority lists, sales standings, or competition results where position, description, and points are the main message.
Q: Why does the split-table design help comparison?
A: The side-by-side layouts reduce vertical scrolling and let the audience compare ranking groups at a glance. Slide 5 separates two labeled ranking sets, while Slide 6 expands one longer sequence across two tables. The repeated headers and alternating rows keep the eye aligned across positions and scores.


Simple Ranking Tables Template for PowerPoint
6-slide presentation template for ranking tables, side-by-side comparisons, and point-based priority lists
The Simple Ranking Tables Template for PowerPoint is a 6-slide table deck for ordering items by position, description, and points. It includes full-width ranking tables, proportional arrow-bar tables, text callout panels, and side-by-side comparison tables for business lists, employee scoring, or priority reviews in Microsoft PowerPoint and Google Slides.
- Category
- Text & Tables
- Rating


 Loading...
- Aspect ratio
- 16:9, 4:3
- Item ID
- 6012-01
- Colors
 Microsoft PowerPoint
 Microsoft Copilot
 Claude for PowerPoint
Other formats supported
Subscribe today and get immediate
access to download our PowerPoint templates.