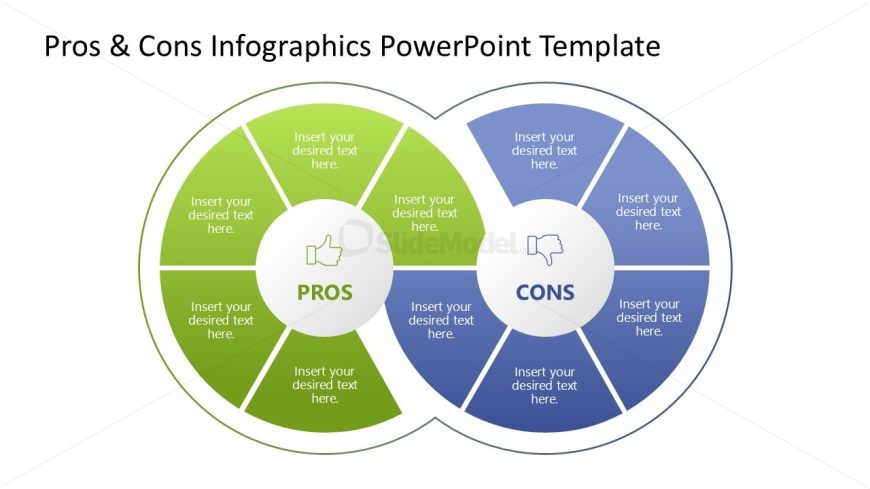
Slide 4 of 9 from Pros & Cons Infographic PowerPoint Template
Two Segmented Overlapping Circles – Pros & Cons Infographic PPT Template
Pros and Cons Comparison Diagram for Presentations
- Diagram
- Venn
- Comparison Slide
- 16:9
- 100% Editable
The Pros and Cons Comparison Diagram from the Pros & Cons Infographic PowerPoint Template offers a clear visual tool for strategic decision-making and project evaluation. This slide template uses overlapping circles to highlight advantages and disadvantages, making it effective for business presentations and pitch decks. Its editable shapes and balanced layout enhance clarity, supporting concise communication of complex information in corporate presentations and slide decks.
What’s on This Slide
The layout features two overlapping circles representing 'Pros' and 'Cons' sections. Each section contains three segments for text, arranged in a circular manner. The 'Pros' section is green, while the 'Cons' section is blue, creating a visual contrast. Central to the diagram is a neutral area for additional content. Text placeholders are present in each segment, aligned to fit within their respective shapes. The overall composition is balanced, with a clear visual hierarchy emphasizing the central themes of advantages and disadvantages.
How to Use It
This layout serves as a comparative analysis tool, ideal for evaluating pros and cons in decision-making scenarios. It fits well in presentations discussing product features, project evaluations, or strategic planning. The diagram can be used to visually summarize key points, making it suitable for business meetings or educational contexts. It effectively conveys complex information in a straightforward manner, allowing for easy audience understanding and engagement.
Text Placeholders & Capacity
Keep your copy within these limits so it fits without resizing. Each segment can hold about 30 characters comfortably.
| Placeholder | Count | Max characters (approx.) |
|---|---|---|
| Item body | 6 | 30 |
Slide Keywords
Download unlimited PowerPoint templates, charts and graphics for your presentations with our annual plan.
DOWNLOADReturn to Pros & Cons Infographic PowerPoint Template.