Slide 10 of 14 from Professional Business Presentation Template
Financials Slide with Data Visualizations
Financials Overview Slide for Business Presentations
- Chart
- Pie Chart
- Financial Summary Slide
- 16:9
- 100% Editable
What’s on This Slide
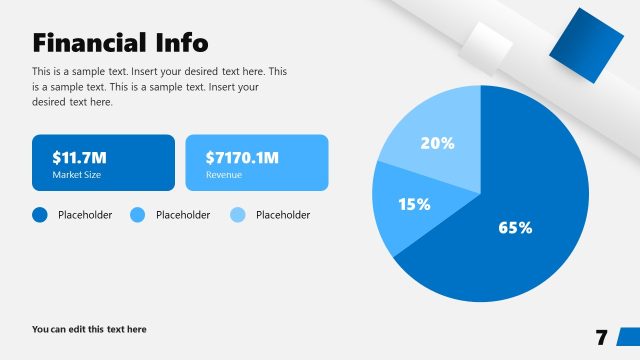
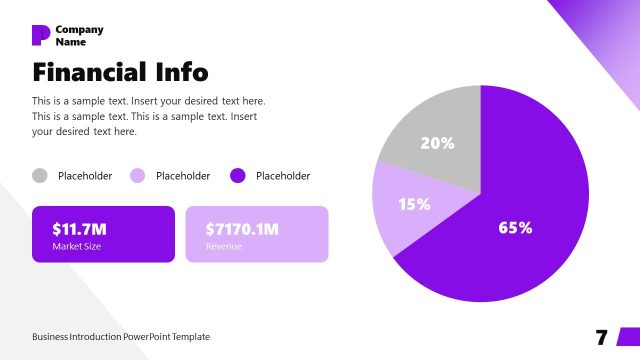
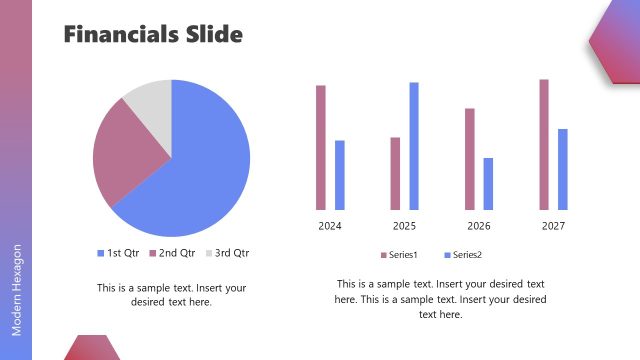
The slide features a large pie chart positioned on the left side, displaying three segments in varying shades of blue. The largest segment represents 65%, while the smaller segments represent 20% and 15%. To the right, there are three text placeholders arranged vertically, with the top placeholder labeled 'Market Size' and displaying a value of '$11.7M'. Below it, a second placeholder shows 'Revenue' with a value of '$7170.1M'. Additional text placeholders are present for further details, aligned beneath the revenue placeholder. The overall layout emphasizes the pie chart and financial figures.
How to Use It
This layout serves to present financial data clearly, making it suitable for financial overviews or business performance summaries. It fits well after introductory slides and before detailed analysis or projections. Ideal scenarios include quarterly financial reviews, investment pitches, or company performance presentations. The pie chart effectively communicates market share or revenue breakdowns, while the text placeholders allow for detailed explanations or additional metrics.
Text Placeholders & Capacity
Keep your copy within these limits so it fits without resizing. Body slots can accommodate roughly 25-30 words each.
| Placeholder | Count | Max characters (approx.) |
|---|---|---|
| Chart title | 1 | 30 |
| Item heading | 3 | 5 |
| Item body | 3 | 15 |
| Body paragraph | 3 | 150 |
Slide Keywords
Download unlimited PowerPoint templates, charts and graphics for your presentations with our annual plan.
DOWNLOADReturn to Professional Business Presentation Template.