Most Organizations imagine that our businesses fill a niche in the market, offering customers a unique product or service that is unobtainable anywhere but from it. However, reality will be that to customers blends into each other: difference in their eyes being translated on mass to the market as a whole. It’s of paramount importance for a company’s CEOs and board of directors to realistically analyse their products and service and to determine (honestly) where they fall upon a map of industry movers and shakers.
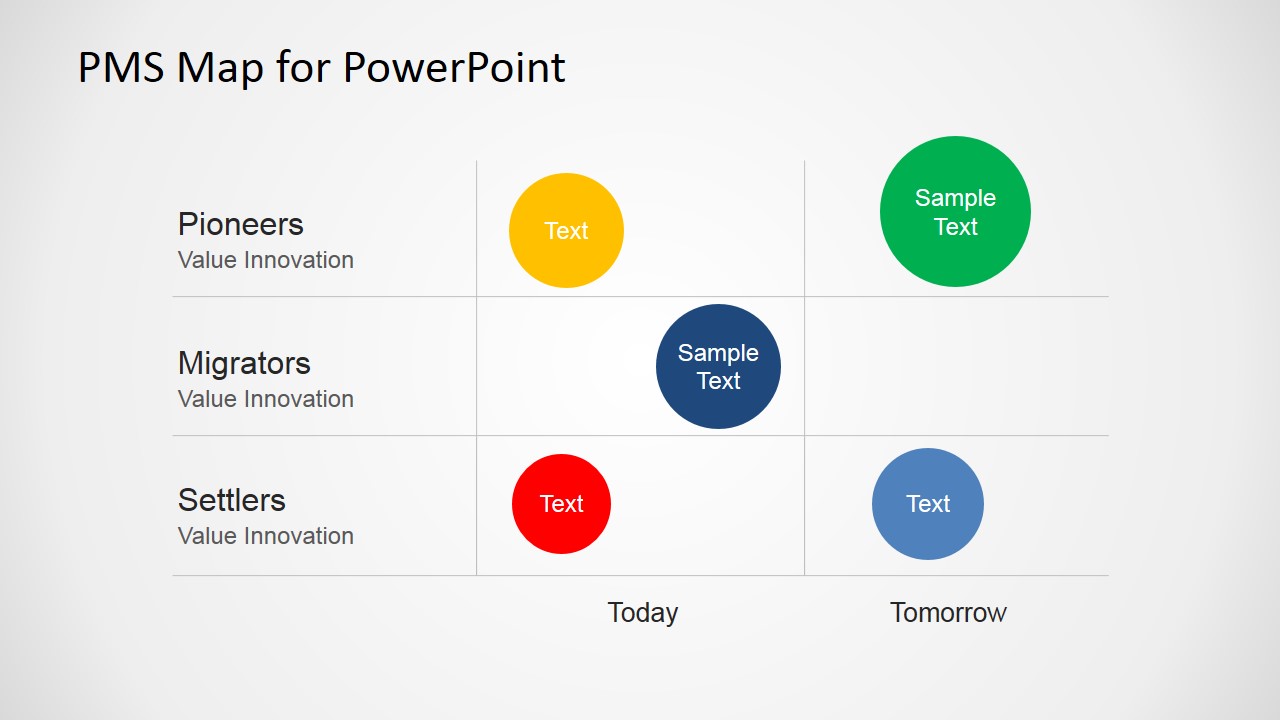
The professionally designed PMS Map for PowerPoint template diagram is the perfect way for you to present this kind of information to your CEOs or board of directors – it’s even a great tool to use if you’re only teaching a set CEOs or board of directors about PMS maps. A PMS map is a crucial diagnostic tool that you can use to assess a company’s performance as a pioneer, migrator or settler. By plotting out a company’s projected revenue, product generation and service delivery you can analyse how these aspects affect your future growth. With this tool you can evaluate your performance in either the contested business or in a clear market, free of competition.
The PMS Map is a great Strategy tool to increase a company’s perceived value. The three product categories which you can use are:
- Settlers: These are products which exist in a contested market and generally have little profit or growth potential; items like cars, white goods, service industries
- Migrators: These are products that hold some value but are no longer innovative. These products typically bridge the gap between contested and uncontested markets and are often carry growth potential – providing some changes are made.
- Pioneers: These products offer overwhelming growth and profit potentials. Laterally speaking these items are like no other market contenders and often are the influencers of next year’s settlers. Consider Apple, Nintendo and Amazon.
This PowerPoint template is entirely editable. All icons and images are formed composites of clip art icons freely available in all PowerPoint applications.
What’s inside this template
Example presentation scenarios
- A strategy consultant can use the migration map to show an executive team how current products may shift from settler or migrator positions toward pioneer opportunities.
- A product manager can use the labeled bubble comparison slide to compare business lines by value innovation and explain which offerings need repositioning.
- A marketing leader can use the pioneer, migrator, and settler rows to explain market differentiation during an annual planning meeting.
- A CEO can use the today-to-tomorrow map in a board presentation to summarize portfolio direction and discuss where investment should move.
Features
- 100% editable presentation template
- Compatible with Microsoft PowerPoint and Google Slides
- 16:9 aspect ratio slides
- Scalable vector shapes, icons and illustrations
- AI-Ready for Microsoft Copilot and Claude
- Instant access and download
Frequently asked questions
Q: How should a presenter explain the PMS map without overloading the audience?
A: Start by defining settlers, migrators, and pioneers in the left labels, then move across the Today and Tomorrow axis. On the first slide, use the smaller bubbles and arrows to show direction of change. On the second slide, name only the most important offerings so the audience focuses on strategic placement, not every portfolio detail.
Q: Who is this template best suited for in a business strategy discussion?
A: This template fits presenters who need to simplify portfolio strategy for senior decision makers. CEOs, product leaders, consultants, and marketing executives can use the PMS map to separate low-growth contested offerings from higher-value pioneer opportunities. It works best when the goal is to align leadership on where to invest, reposition, or retire offerings.
Q: Why does the pioneer, migrator, and settler structure help the message?
A: The map turns an abstract innovation discussion into a spatial comparison. Rows show value innovation levels, while the Today and Tomorrow axis shows movement over time. Bubbles make each offering easy to place and compare, and the upward arrows on the first slide reinforce the intended shift toward stronger market differentiation.



PMS Map for PowerPoint
2-slide presentation template with PMS map diagrams for pioneers, migrators, and settlers
PMS Map for PowerPoint is a 2-slide diagram template for plotting products, services, or business units across settlers, migrators, and pioneers. It includes a bubble migration map and a labeled bubble comparison map for strategy discussions, portfolio reviews, and market positioning in Microsoft PowerPoint and Google Slides.
- Category
- Diagrams
- Rating


 Loading...
- Aspect ratio
- 16:9, 4:3
- Item ID
- 6549-02
- Colors
 Microsoft PowerPoint
 Microsoft Copilot
 Claude for PowerPoint
Other formats supported
Subscribe today and get immediate
access to download our PowerPoint templates.