Slide 9 of 11 from Pixel Perspective PowerPoint Template
Area Chart Analysis for Pixel Perspective
Area Chart Analysis Slide for Presentations
- Chart
- Area Chart
- Evaluation Slide
- 16:9
- 100% Editable
The Area Chart Analysis Slide from the Pixel Perspective PowerPoint Template offers a clear visualization of data trends over time, making it suitable for business presentations focused on sales performance, project progress, or market analysis. This slide layout integrates editable shapes and vector icons to enhance data communication within a corporate presentation or pitch deck template.
What’s on This Slide
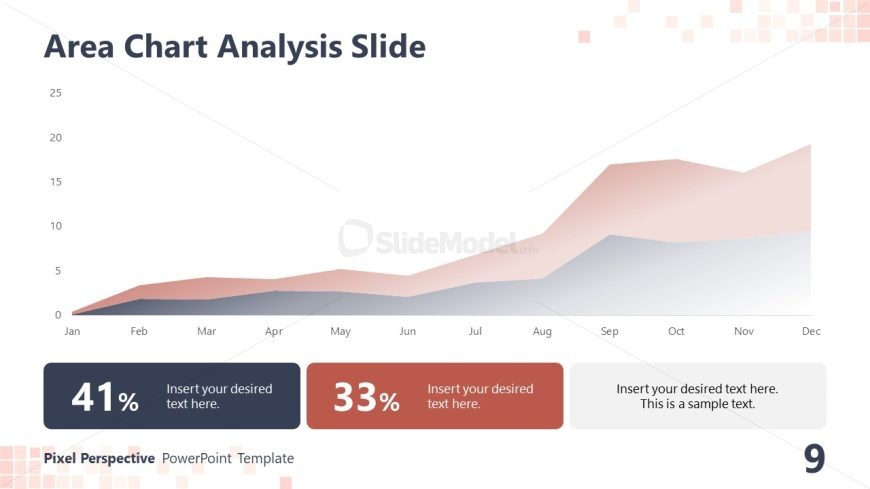
The slide features an area chart positioned centrally, displaying data over months from January to December. The chart uses two color gradients, one in red and the other in blue, to represent different data sets. Below the chart, there are three text placeholders: two rectangular boxes on the left and center for percentage values, and a larger box on the right for additional text. The title is located at the top, aligned left, while the background is a light gradient with pixel patterns. The overall layout emphasizes the chart as the primary focus.
How to Use It
This layout serves as a data visualization tool, ideal for presenting trends or comparisons over time. It fits well after problem identification slides, helping to illustrate data-driven insights. Common scenarios include sales performance reviews, project progress tracking, or market analysis presentations. The structure allows for clear communication of quantitative information, making it suitable for business meetings or stakeholder updates.
Text Placeholders & Capacity
Keep your copy within these limits so it fits without resizing. Text slots are tight, roughly 10-15 words each.
| Placeholder | Count | Max characters (approx.) |
|---|---|---|
| Slide title | 1 | 30 |
| Item heading | 2 | 10 |
| Item body | 1 | 100 |
Slide Keywords
Download unlimited PowerPoint templates, charts and graphics for your presentations with our annual plan.
DOWNLOADReturn to Pixel Perspective PowerPoint Template.